VanguardRussell VONG full analysis,charts,indicators,moving averages,SMA,DMA,EMA,ADX,MACD,RSIVanguard Russell VONG WideScreen charts, DMA,SMA,EMA technical analysis, forecast prediction, by indicators ADX,MACD,RSI,CCI NASDAQ stock exchange
operates under N A sector & deals in N A
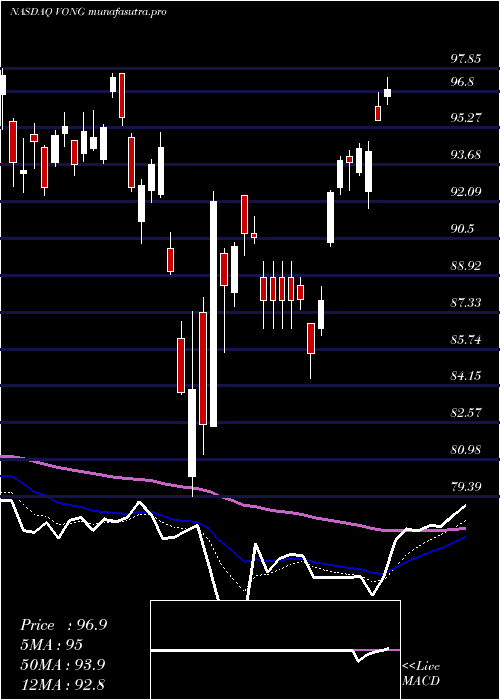
Daily price and charts and targets VanguardRussell Strong Daily Stock price targets for VanguardRussell VONG are 122.56 and 123.45 | Daily Target 1 | 122.35 | | Daily Target 2 | 122.76 | | Daily Target 3 | 123.23666666667 | | Daily Target 4 | 123.65 | | Daily Target 5 | 124.13 |
Daily price and volume Vanguard Russell
| Date |
Closing |
Open |
Range |
Volume |
Fri 05 December 2025 |
123.18 (0.25%) |
123.19 |
122.82 - 123.71 |
0.7932 times |
Thu 04 December 2025 |
122.87 (0.19%) |
123.19 |
122.17 - 123.19 |
1.0488 times |
Wed 03 December 2025 |
122.64 (-0.05%) |
122.21 |
121.84 - 122.93 |
1.2201 times |
Tue 02 December 2025 |
122.70 (0.37%) |
122.75 |
122.30 - 123.42 |
1.0885 times |
Mon 01 December 2025 |
122.25 (-0.33%) |
121.68 |
121.38 - 122.63 |
1.0064 times |
Fri 28 November 2025 |
122.66 (0.45%) |
122.35 |
122.06 - 122.66 |
0.4855 times |
Wed 26 November 2025 |
122.11 (0.75%) |
122.04 |
121.50 - 122.52 |
0.885 times |
Tue 25 November 2025 |
121.20 (0.82%) |
120.00 |
118.82 - 121.43 |
0.8831 times |
Mon 24 November 2025 |
120.22 (2.12%) |
118.58 |
118.58 - 120.56 |
0.841 times |
Fri 21 November 2025 |
117.73 (0.59%) |
117.37 |
115.97 - 119.06 |
1.7483 times |
Thu 20 November 2025 |
117.04 (-2.03%) |
122.04 |
116.89 - 122.39 |
1.5831 times |
Weekly price and charts VanguardRussell Strong weekly Stock price targets for VanguardRussell VONG are 122.28 and 124.61 | Weekly Target 1 | 120.43 | | Weekly Target 2 | 121.8 | | Weekly Target 3 | 122.75666666667 | | Weekly Target 4 | 124.13 | | Weekly Target 5 | 125.09 |
Weekly price and volumes for Vanguard Russell
| Date |
Closing |
Open |
Range |
Volume |
Fri 05 December 2025 |
123.18 (0.42%) |
121.68 |
121.38 - 123.71 |
0.7987 times |
Fri 28 November 2025 |
122.66 (4.19%) |
118.58 |
118.58 - 122.66 |
0.4793 times |
Fri 21 November 2025 |
117.73 (-2.86%) |
120.57 |
115.97 - 122.39 |
1.2336 times |
Fri 14 November 2025 |
121.20 (-0.1%) |
122.87 |
118.80 - 124.40 |
0.7858 times |
Fri 07 November 2025 |
121.32 (-2.87%) |
123.82 |
119.11 - 124.58 |
2.6461 times |
Fri 31 October 2025 |
124.91 (0%) |
126.22 |
124.47 - 126.22 |
0.4156 times |
Fri 31 October 2025 |
124.91 (1.78%) |
124.14 |
124.07 - 126.83 |
1.2017 times |
Fri 24 October 2025 |
122.72 (2.06%) |
120.77 |
119.55 - 123.09 |
0.6948 times |
Fri 17 October 2025 |
120.24 (1.73%) |
120.25 |
118.07 - 121.27 |
0.8099 times |
Fri 10 October 2025 |
118.20 (-2.25%) |
121.10 |
118.16 - 122.66 |
0.9344 times |
Fri 03 October 2025 |
120.92 (1.14%) |
120.18 |
119.47 - 121.89 |
1.2642 times |
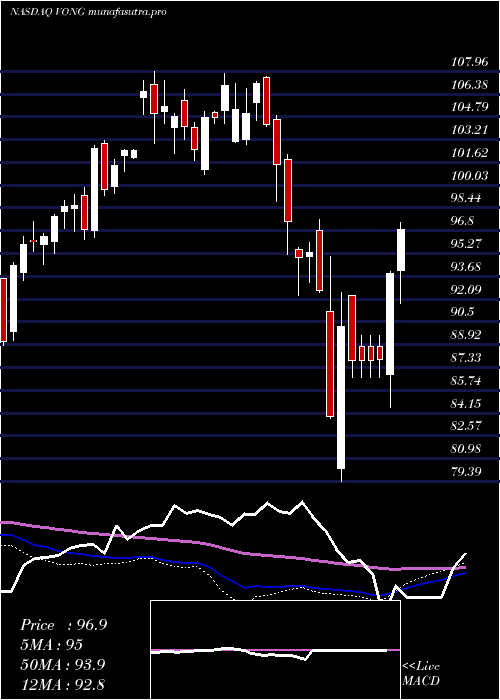
Monthly price and charts VanguardRussell Strong monthly Stock price targets for VanguardRussell VONG are 122.28 and 124.61 | Monthly Target 1 | 120.43 | | Monthly Target 2 | 121.8 | | Monthly Target 3 | 122.75666666667 | | Monthly Target 4 | 124.13 | | Monthly Target 5 | 125.09 |
Monthly price and volumes Vanguard Russell
| Date |
Closing |
Open |
Range |
Volume |
Fri 05 December 2025 |
123.18 (0.42%) |
121.68 |
121.38 - 123.71 |
0.2454 times |
Fri 28 November 2025 |
122.66 (-1.8%) |
123.82 |
115.97 - 124.58 |
1.5808 times |
Fri 31 October 2025 |
124.91 (3.66%) |
119.89 |
118.07 - 126.83 |
1.3635 times |
Tue 30 September 2025 |
120.50 (5.08%) |
112.85 |
112.42 - 121.82 |
0.9932 times |
Fri 29 August 2025 |
114.67 (1.11%) |
112.15 |
110.65 - 116.49 |
0.7148 times |
Thu 31 July 2025 |
113.41 (3.86%) |
108.83 |
107.69 - 115.48 |
0.6912 times |
Mon 30 June 2025 |
109.20 (6.22%) |
102.34 |
102.10 - 109.52 |
0.6288 times |
Fri 30 May 2025 |
102.81 (9.06%) |
96.21 |
94.63 - 104.05 |
0.656 times |
Wed 30 April 2025 |
94.27 (1.59%) |
92.58 |
79.39 - 95.08 |
1.5582 times |
Mon 31 March 2025 |
92.79 (-8.56%) |
101.86 |
90.29 - 102.20 |
1.5681 times |
Fri 28 February 2025 |
101.48 (-3.64%) |
103.21 |
98.90 - 107.59 |
0.7237 times |
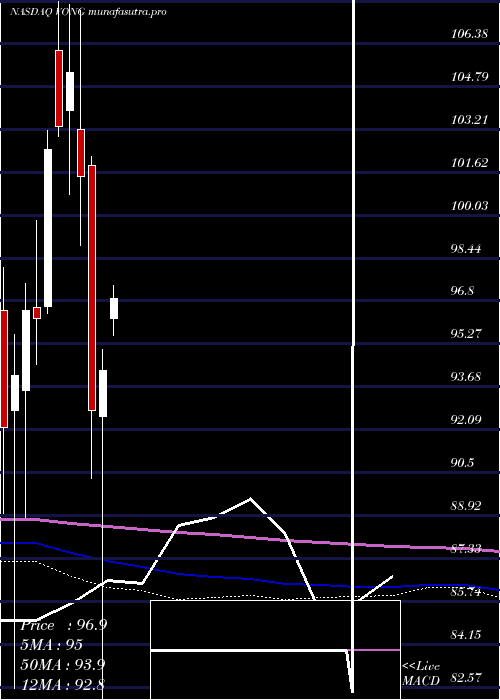
DMA SMA EMA moving averages of Vanguard Russell VONG
DMA (daily moving average) of Vanguard Russell VONG
| DMA period | DMA value | | 5 day DMA | 122.73 | | 12 day DMA | 121.17 | | 20 day DMA | 121.37 | | 35 day DMA | 122.17 | | 50 day DMA | 121.68 | | 100 day DMA | 118.52 | | 150 day DMA | 113.83 | | 200 day DMA | 108.83 | EMA (exponential moving average) of Vanguard Russell VONG
| EMA period | EMA current | EMA prev | EMA prev2 | | 5 day EMA | 122.67 | 122.42 | 122.19 | | 12 day EMA | 122 | 121.79 | 121.59 | | 20 day EMA | 121.82 | 121.68 | 121.55 | | 35 day EMA | 121.55 | 121.45 | 121.37 | | 50 day EMA | 121.67 | 121.61 | 121.56 |
SMA (simple moving average) of Vanguard Russell VONG
| SMA period | SMA current | SMA prev | SMA prev2 | | 5 day SMA | 122.73 | 122.62 | 122.47 | | 12 day SMA | 121.17 | 120.79 | 120.55 | | 20 day SMA | 121.37 | 121.29 | 121.32 | | 35 day SMA | 122.17 | 122.07 | 121.99 | | 50 day SMA | 121.68 | 121.6 | 121.54 | | 100 day SMA | 118.52 | 118.4 | 118.28 | | 150 day SMA | 113.83 | 113.65 | 113.46 | | 200 day SMA | 108.83 | 108.75 | 108.67 |
|
|
