VodafoneGroup VOD full analysis,charts,indicators,moving averages,SMA,DMA,EMA,ADX,MACD,RSIVodafone Group VOD WideScreen charts, DMA,SMA,EMA technical analysis, forecast prediction, by indicators ADX,MACD,RSI,CCI NASDAQ stock exchange
operates under Public Utilities sector & deals in Telecommunications Equipment
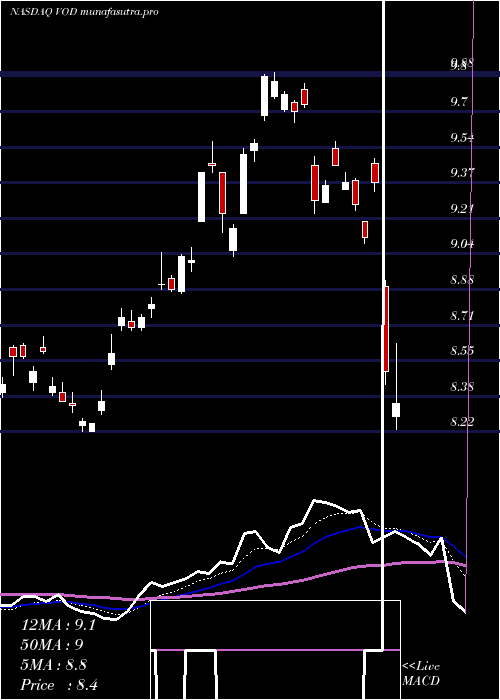
Daily price and charts and targets VodafoneGroup Strong Daily Stock price targets for VodafoneGroup VOD are 10.83 and 10.95 | Daily Target 1 | 10.81 | | Daily Target 2 | 10.85 | | Daily Target 3 | 10.926666666667 | | Daily Target 4 | 10.97 | | Daily Target 5 | 11.05 |
Daily price and volume Vodafone Group
| Date |
Closing |
Open |
Range |
Volume |
Mon 14 July 2025 |
10.90 (0.55%) |
10.94 |
10.88 - 11.00 |
0.6995 times |
Fri 11 July 2025 |
10.84 (-0.64%) |
10.86 |
10.78 - 10.88 |
0.6703 times |
Thu 10 July 2025 |
10.91 (0.28%) |
10.87 |
10.84 - 10.96 |
0.6228 times |
Wed 09 July 2025 |
10.88 (0.09%) |
10.94 |
10.87 - 10.97 |
0.8392 times |
Tue 08 July 2025 |
10.87 (-0.46%) |
10.83 |
10.81 - 10.88 |
0.8246 times |
Mon 07 July 2025 |
10.92 (1.3%) |
11.01 |
10.90 - 11.03 |
1.3602 times |
Thu 03 July 2025 |
10.78 (1.03%) |
10.75 |
10.74 - 10.81 |
0.8615 times |
Wed 02 July 2025 |
10.67 (-2.2%) |
10.67 |
10.61 - 10.71 |
1.5018 times |
Tue 01 July 2025 |
10.91 (2.35%) |
10.84 |
10.81 - 10.93 |
1.2427 times |
Mon 30 June 2025 |
10.66 (1.04%) |
10.53 |
10.52 - 10.67 |
1.3774 times |
Fri 27 June 2025 |
10.55 (-1.03%) |
10.61 |
10.51 - 10.61 |
1.1835 times |
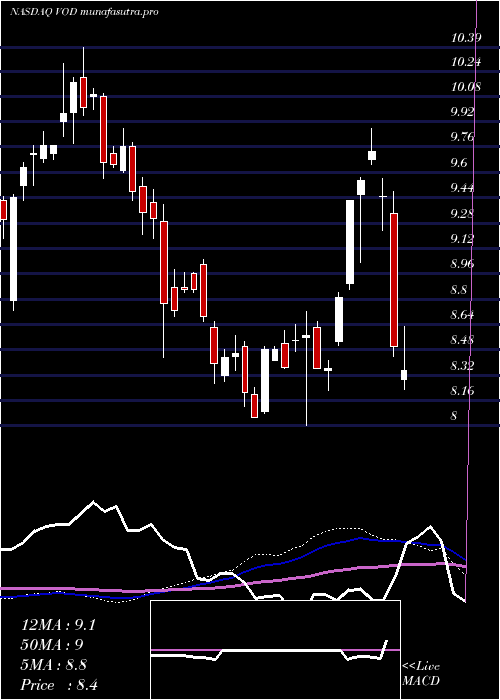
Weekly price and charts VodafoneGroup Strong weekly Stock price targets for VodafoneGroup VOD are 10.83 and 10.95 | Weekly Target 1 | 10.81 | | Weekly Target 2 | 10.85 | | Weekly Target 3 | 10.926666666667 | | Weekly Target 4 | 10.97 | | Weekly Target 5 | 11.05 |
Weekly price and volumes for Vodafone Group
| Date |
Closing |
Open |
Range |
Volume |
Mon 14 July 2025 |
10.90 (0.55%) |
10.94 |
10.88 - 11.00 |
0.0989 times |
Fri 11 July 2025 |
10.84 (0.56%) |
11.01 |
10.78 - 11.03 |
0.6106 times |
Thu 03 July 2025 |
10.78 (2.18%) |
10.53 |
10.52 - 10.93 |
0.7049 times |
Fri 27 June 2025 |
10.55 (3.43%) |
10.06 |
10.06 - 10.70 |
1.0345 times |
Fri 20 June 2025 |
10.20 (2.2%) |
10.18 |
10.03 - 10.36 |
1.0302 times |
Fri 13 June 2025 |
9.98 (0.4%) |
9.85 |
9.80 - 10.06 |
1.0488 times |
Fri 06 June 2025 |
9.94 (-3.87%) |
10.39 |
9.89 - 10.45 |
1.3603 times |
Fri 30 May 2025 |
10.34 (-1.24%) |
10.31 |
10.29 - 10.50 |
1.0833 times |
Fri 23 May 2025 |
10.47 (10.79%) |
9.61 |
9.54 - 10.60 |
1.7875 times |
Fri 16 May 2025 |
9.45 (1.61%) |
9.14 |
8.98 - 9.45 |
1.241 times |
Fri 09 May 2025 |
9.30 (-3.23%) |
9.63 |
9.21 - 9.73 |
1.2372 times |
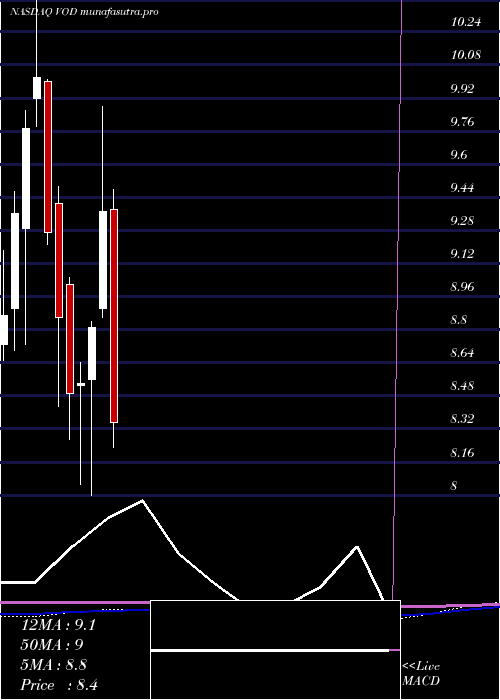
Monthly price and charts VodafoneGroup Strong monthly Stock price targets for VodafoneGroup VOD are 10.76 and 11.18 | Monthly Target 1 | 10.43 | | Monthly Target 2 | 10.66 | | Monthly Target 3 | 10.846666666667 | | Monthly Target 4 | 11.08 | | Monthly Target 5 | 11.27 |
Monthly price and volumes Vodafone Group
| Date |
Closing |
Open |
Range |
Volume |
Mon 14 July 2025 |
10.90 (2.25%) |
10.84 |
10.61 - 11.03 |
0.3962 times |
Mon 30 June 2025 |
10.66 (3.09%) |
10.39 |
9.80 - 10.70 |
1.5167 times |
Fri 30 May 2025 |
10.34 (5.94%) |
9.79 |
8.98 - 10.60 |
1.8896 times |
Wed 30 April 2025 |
9.76 (4.16%) |
9.38 |
8.05 - 9.78 |
1.4149 times |
Mon 31 March 2025 |
9.37 (6.36%) |
8.90 |
8.86 - 9.88 |
1.252 times |
Fri 28 February 2025 |
8.81 (3.16%) |
8.56 |
8.00 - 8.84 |
1.073 times |
Fri 31 January 2025 |
8.54 (0.59%) |
8.53 |
8.05 - 8.64 |
0.7945 times |
Tue 31 December 2024 |
8.49 (-4.18%) |
9.02 |
8.27 - 9.05 |
0.5834 times |
Tue 26 November 2024 |
8.86 (-4.42%) |
9.41 |
8.43 - 9.49 |
0.6167 times |
Thu 31 October 2024 |
9.27 (-7.49%) |
10.00 |
9.21 - 10.01 |
0.4629 times |
Mon 30 September 2024 |
10.02 (2.56%) |
9.92 |
9.78 - 10.39 |
0.4804 times |
DMA SMA EMA moving averages of Vodafone Group VOD
DMA (daily moving average) of Vodafone Group VOD
| DMA period | DMA value | | 5 day DMA | 10.88 | | 12 day DMA | 10.8 | | 20 day DMA | 10.54 | | 35 day DMA | 10.41 | | 50 day DMA | 10.13 | | 100 day DMA | 9.63 | | 150 day DMA | 9.24 | | 200 day DMA | 9.29 | EMA (exponential moving average) of Vodafone Group VOD
| EMA period | EMA current | EMA prev | EMA prev2 | | 5 day EMA | 10.87 | 10.85 | 10.86 | | 12 day EMA | 10.76 | 10.73 | 10.71 | | 20 day EMA | 10.61 | 10.58 | 10.55 | | 35 day EMA | 10.38 | 10.35 | 10.32 | | 50 day EMA | 10.14 | 10.11 | 10.08 |
SMA (simple moving average) of Vodafone Group VOD
| SMA period | SMA current | SMA prev | SMA prev2 | | 5 day SMA | 10.88 | 10.88 | 10.87 | | 12 day SMA | 10.8 | 10.75 | 10.72 | | 20 day SMA | 10.54 | 10.49 | 10.44 | | 35 day SMA | 10.41 | 10.4 | 10.37 | | 50 day SMA | 10.13 | 10.11 | 10.08 | | 100 day SMA | 9.63 | 9.6 | 9.58 | | 150 day SMA | 9.24 | 9.23 | 9.21 | | 200 day SMA | 9.29 | 9.29 | 9.29 |
|
|
