ValleyNational VLY full analysis,charts,indicators,moving averages,SMA,DMA,EMA,ADX,MACD,RSIValley National VLY WideScreen charts, DMA,SMA,EMA technical analysis, forecast prediction, by indicators ADX,MACD,RSI,CCI NASDAQ stock exchange
operates under Finance sector & deals in Major Banks
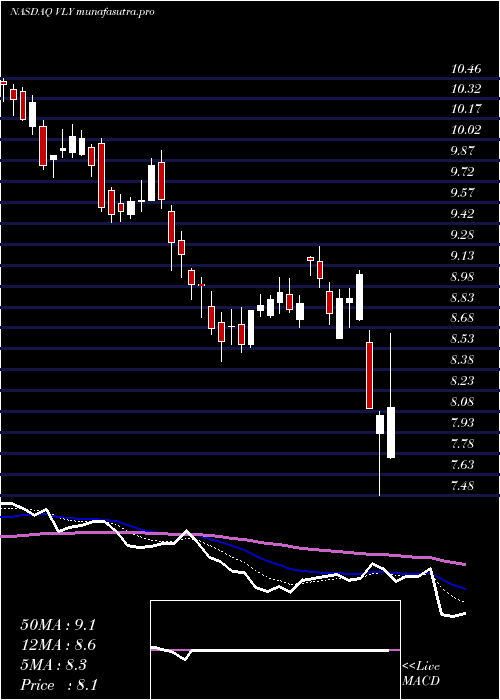
Daily price and charts and targets ValleyNational Strong Daily Stock price targets for ValleyNational VLY are 7.93 and 8.83 | Daily Target 1 | 7.26 | | Daily Target 2 | 7.69 | | Daily Target 3 | 8.1633333333333 | | Daily Target 4 | 8.59 | | Daily Target 5 | 9.06 |
Daily price and volume Valley National
| Date |
Closing |
Open |
Range |
Volume |
Mon 07 April 2025 |
8.11 (0.75%) |
7.75 |
7.74 - 8.64 |
2.2458 times |
Fri 04 April 2025 |
8.05 (-0.62%) |
7.92 |
7.48 - 8.08 |
1.7085 times |
Thu 03 April 2025 |
8.10 (-10.6%) |
8.57 |
8.10 - 8.66 |
0.8521 times |
Wed 02 April 2025 |
9.06 (1.91%) |
8.74 |
8.73 - 9.09 |
0.7831 times |
Tue 01 April 2025 |
8.89 (0%) |
8.86 |
8.68 - 8.96 |
0.7657 times |
Mon 31 March 2025 |
8.89 (1.25%) |
8.60 |
8.60 - 8.95 |
0.6997 times |
Fri 28 March 2025 |
8.78 (-2.77%) |
8.94 |
8.70 - 9.00 |
0.4582 times |
Wed 26 March 2025 |
9.03 (-1.42%) |
9.15 |
8.97 - 9.26 |
0.5029 times |
Mon 24 March 2025 |
9.16 (3.5%) |
9.18 |
9.05 - 9.19 |
0.6007 times |
Fri 21 March 2025 |
8.85 (0.45%) |
8.74 |
8.68 - 8.91 |
1.3833 times |
Thu 20 March 2025 |
8.81 (-1.34%) |
8.92 |
8.79 - 9.03 |
0.4878 times |
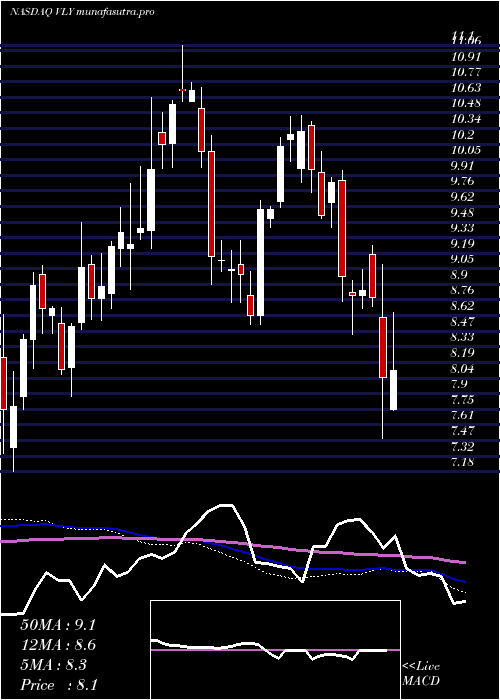
Weekly price and charts ValleyNational Strong weekly Stock price targets for ValleyNational VLY are 7.93 and 8.83 | Weekly Target 1 | 7.26 | | Weekly Target 2 | 7.69 | | Weekly Target 3 | 8.1633333333333 | | Weekly Target 4 | 8.59 | | Weekly Target 5 | 9.06 |
Weekly price and volumes for Valley National
| Date |
Closing |
Open |
Range |
Volume |
Mon 07 April 2025 |
8.11 (0.75%) |
7.75 |
7.74 - 8.64 |
0.6984 times |
Fri 04 April 2025 |
8.05 (-8.31%) |
8.60 |
7.48 - 9.09 |
1.4956 times |
Fri 28 March 2025 |
8.78 (-0.79%) |
9.18 |
8.70 - 9.26 |
0.4857 times |
Fri 21 March 2025 |
8.85 (0.57%) |
8.80 |
8.68 - 9.04 |
1.0676 times |
Fri 14 March 2025 |
8.80 (-2%) |
8.83 |
8.44 - 8.94 |
1.03 times |
Fri 07 March 2025 |
8.98 (-8.74%) |
9.86 |
8.75 - 9.95 |
1.14 times |
Fri 28 February 2025 |
9.84 (3.14%) |
9.66 |
9.43 - 9.89 |
1.2095 times |
Fri 21 February 2025 |
9.54 (-4.22%) |
9.93 |
9.51 - 10.13 |
0.612 times |
Fri 14 February 2025 |
9.96 (-3.39%) |
10.37 |
9.75 - 10.40 |
1.0764 times |
Fri 07 February 2025 |
10.31 (0.29%) |
9.97 |
9.84 - 10.46 |
1.1847 times |
Fri 31 January 2025 |
10.28 (1.08%) |
10.24 |
10.03 - 10.45 |
1.3932 times |
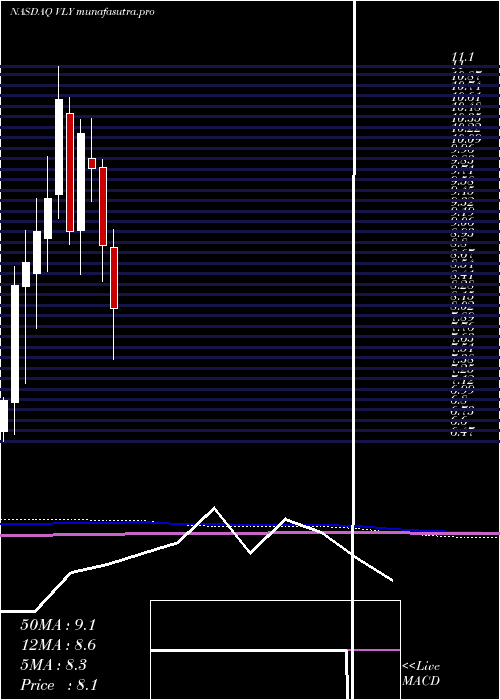
Monthly price and charts ValleyNational Strong monthly Stock price targets for ValleyNational VLY are 6.99 and 8.6 | Monthly Target 1 | 6.62 | | Monthly Target 2 | 7.36 | | Monthly Target 3 | 8.2266666666667 | | Monthly Target 4 | 8.97 | | Monthly Target 5 | 9.84 |
Monthly price and volumes Valley National
| Date |
Closing |
Open |
Range |
Volume |
Mon 07 April 2025 |
8.11 (-8.77%) |
8.86 |
7.48 - 9.09 |
0.5413 times |
Mon 31 March 2025 |
8.89 (-9.65%) |
9.86 |
8.44 - 9.95 |
1.0793 times |
Fri 28 February 2025 |
9.84 (-4.28%) |
9.97 |
9.43 - 10.46 |
1.1181 times |
Fri 31 January 2025 |
10.28 (13.47%) |
9.08 |
8.53 - 10.45 |
1.4133 times |
Tue 31 December 2024 |
9.06 (-15.25%) |
10.52 |
8.90 - 10.72 |
0.716 times |
Tue 26 November 2024 |
10.69 (12.88%) |
9.52 |
9.23 - 11.10 |
1.3935 times |
Thu 31 October 2024 |
9.47 (4.53%) |
8.98 |
8.57 - 9.99 |
0.8 times |
Mon 30 September 2024 |
9.06 (4.38%) |
8.54 |
7.87 - 9.47 |
0.9836 times |
Fri 30 August 2024 |
8.68 (3.33%) |
8.38 |
7.18 - 9.08 |
0.8539 times |
Wed 31 July 2024 |
8.40 (20.34%) |
6.95 |
6.56 - 8.63 |
1.1009 times |
Fri 28 June 2024 |
6.98 (-2.1%) |
7.32 |
6.47 - 7.32 |
0.8028 times |
DMA SMA EMA moving averages of Valley National VLY
DMA (daily moving average) of Valley National VLY
| DMA period | DMA value | | 5 day DMA | 8.44 | | 12 day DMA | 8.72 | | 20 day DMA | 8.73 | | 35 day DMA | 9.12 | | 50 day DMA | 9.44 | | 100 day DMA | 9.57 | | 150 day DMA | 9.34 | | 200 day DMA | 8.88 | EMA (exponential moving average) of Valley National VLY
| EMA period | EMA current | EMA prev | EMA prev2 | | 5 day EMA | 8.34 | 8.46 | 8.67 | | 12 day EMA | 8.61 | 8.7 | 8.82 | | 20 day EMA | 8.78 | 8.85 | 8.93 | | 35 day EMA | 9.08 | 9.14 | 9.2 | | 50 day EMA | 9.35 | 9.4 | 9.45 |
SMA (simple moving average) of Valley National VLY
| SMA period | SMA current | SMA prev | SMA prev2 | | 5 day SMA | 8.44 | 8.6 | 8.74 | | 12 day SMA | 8.72 | 8.79 | 8.85 | | 20 day SMA | 8.73 | 8.78 | 8.83 | | 35 day SMA | 9.12 | 9.17 | 9.23 | | 50 day SMA | 9.44 | 9.47 | 9.51 | | 100 day SMA | 9.57 | 9.59 | 9.6 | | 150 day SMA | 9.34 | 9.34 | 9.34 | | 200 day SMA | 8.88 | 8.88 | 8.87 |
|
|
