VanguardInternational VIGI full analysis,charts,indicators,moving averages,SMA,DMA,EMA,ADX,MACD,RSIVanguard International VIGI WideScreen charts, DMA,SMA,EMA technical analysis, forecast prediction, by indicators ADX,MACD,RSI,CCI NASDAQ stock exchange
operates under N A sector & deals in N A
Daily price and charts and targets VanguardInternational Strong Daily Stock price targets for VanguardInternational VIGI are 88.38 and 88.86 | Daily Target 1 | 88.28 | | Daily Target 2 | 88.48 | | Daily Target 3 | 88.76 | | Daily Target 4 | 88.96 | | Daily Target 5 | 89.24 |
Daily price and volume Vanguard International
| Date |
Closing |
Open |
Range |
Volume |
Fri 11 July 2025 |
88.68 (-0.98%) |
89.04 |
88.56 - 89.04 |
0.8928 times |
Thu 10 July 2025 |
89.56 (-0.13%) |
89.41 |
89.16 - 89.69 |
0.9134 times |
Wed 09 July 2025 |
89.68 (0.37%) |
89.43 |
89.19 - 89.79 |
1.1989 times |
Tue 08 July 2025 |
89.35 (0.37%) |
89.04 |
88.97 - 89.49 |
1.0411 times |
Mon 07 July 2025 |
89.02 (-1.2%) |
89.52 |
88.82 - 89.61 |
0.9723 times |
Thu 03 July 2025 |
90.10 (0.02%) |
90.00 |
89.81 - 90.23 |
0.7361 times |
Wed 02 July 2025 |
90.08 (-0.12%) |
89.70 |
89.46 - 90.09 |
0.8517 times |
Tue 01 July 2025 |
90.19 (0.08%) |
89.96 |
89.86 - 90.31 |
1.5229 times |
Mon 30 June 2025 |
90.12 (-0.02%) |
89.82 |
89.67 - 90.19 |
0.9662 times |
Fri 27 June 2025 |
90.14 (0.94%) |
90.10 |
89.77 - 90.47 |
0.9045 times |
Thu 26 June 2025 |
89.30 (1.25%) |
89.06 |
88.94 - 89.36 |
1.0652 times |

Weekly price and charts VanguardInternational Strong weekly Stock price targets for VanguardInternational VIGI are 88.01 and 89.24 | Weekly Target 1 | 87.78 | | Weekly Target 2 | 88.23 | | Weekly Target 3 | 89.01 | | Weekly Target 4 | 89.46 | | Weekly Target 5 | 90.24 |
Weekly price and volumes for Vanguard International
| Date |
Closing |
Open |
Range |
Volume |
Fri 11 July 2025 |
88.68 (-1.58%) |
89.52 |
88.56 - 89.79 |
0.991 times |
Thu 03 July 2025 |
90.10 (-0.04%) |
89.82 |
89.46 - 90.31 |
0.8051 times |
Fri 27 June 2025 |
90.14 (3.1%) |
86.82 |
86.70 - 90.47 |
1.1801 times |
Fri 20 June 2025 |
87.43 (-2.81%) |
89.57 |
87.40 - 89.57 |
0.6575 times |
Fri 13 June 2025 |
89.96 (-0.52%) |
90.42 |
89.83 - 91.19 |
1.0265 times |
Fri 06 June 2025 |
90.43 (0.86%) |
89.96 |
89.41 - 90.63 |
1.1357 times |
Fri 30 May 2025 |
89.66 (1.01%) |
90.09 |
88.90 - 90.30 |
0.8306 times |
Fri 23 May 2025 |
88.76 (0.99%) |
87.69 |
87.69 - 89.16 |
1.0704 times |
Fri 16 May 2025 |
87.89 (1.64%) |
86.59 |
86.18 - 87.89 |
1.3462 times |
Fri 09 May 2025 |
86.47 (-0.85%) |
87.45 |
86.17 - 87.58 |
0.957 times |
Fri 02 May 2025 |
87.21 (2.65%) |
85.16 |
85.16 - 87.36 |
1.0588 times |
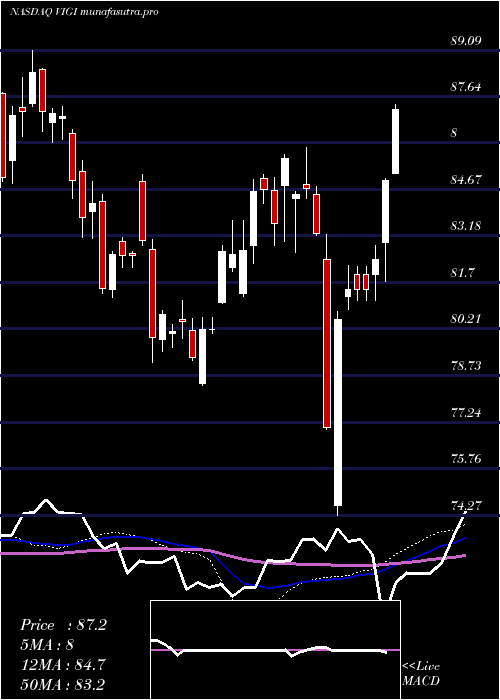
Monthly price and charts VanguardInternational Strong monthly Stock price targets for VanguardInternational VIGI are 87.75 and 89.5 | Monthly Target 1 | 87.43 | | Monthly Target 2 | 88.06 | | Monthly Target 3 | 89.183333333333 | | Monthly Target 4 | 89.81 | | Monthly Target 5 | 90.93 |
Monthly price and volumes Vanguard International
| Date |
Closing |
Open |
Range |
Volume |
Fri 11 July 2025 |
88.68 (-1.6%) |
89.96 |
88.56 - 90.31 |
0.4114 times |
Mon 30 June 2025 |
90.12 (0.51%) |
89.96 |
86.70 - 91.19 |
1.0739 times |
Fri 30 May 2025 |
89.66 (3.94%) |
86.27 |
85.54 - 90.30 |
1.21 times |
Wed 30 April 2025 |
86.26 (4%) |
82.82 |
74.27 - 86.46 |
1.2194 times |
Mon 31 March 2025 |
82.94 (-0.78%) |
84.80 |
82.13 - 86.00 |
1.2123 times |
Fri 28 February 2025 |
83.59 (1.24%) |
81.34 |
81.23 - 85.15 |
1.0616 times |
Fri 31 January 2025 |
82.57 (3.23%) |
80.18 |
78.41 - 83.66 |
1.246 times |
Tue 31 December 2024 |
79.99 (-3.09%) |
84.91 |
79.14 - 85.15 |
0.7751 times |
Tue 26 November 2024 |
82.54 (-1.37%) |
84.02 |
81.21 - 84.91 |
0.9558 times |
Thu 31 October 2024 |
83.69 (-5.2%) |
88.54 |
83.12 - 88.54 |
0.8346 times |
Mon 30 September 2024 |
88.28 (0.33%) |
87.73 |
84.85 - 89.09 |
0.6819 times |
DMA SMA EMA moving averages of Vanguard International VIGI
DMA (daily moving average) of Vanguard International VIGI
| DMA period | DMA value | | 5 day DMA | 89.26 | | 12 day DMA | 89.54 | | 20 day DMA | 89.39 | | 35 day DMA | 89.5 | | 50 day DMA | 88.71 | | 100 day DMA | 85.91 | | 150 day DMA | 84.51 | | 200 day DMA | 84.76 | EMA (exponential moving average) of Vanguard International VIGI
| EMA period | EMA current | EMA prev | EMA prev2 | | 5 day EMA | 89.28 | 89.58 | 89.59 | | 12 day EMA | 89.41 | 89.54 | 89.54 | | 20 day EMA | 89.36 | 89.43 | 89.42 | | 35 day EMA | 88.85 | 88.86 | 88.82 | | 50 day EMA | 88.39 | 88.38 | 88.33 |
SMA (simple moving average) of Vanguard International VIGI
| SMA period | SMA current | SMA prev | SMA prev2 | | 5 day SMA | 89.26 | 89.54 | 89.65 | | 12 day SMA | 89.54 | 89.55 | 89.41 | | 20 day SMA | 89.39 | 89.49 | 89.53 | | 35 day SMA | 89.5 | 89.49 | 89.45 | | 50 day SMA | 88.71 | 88.65 | 88.55 | | 100 day SMA | 85.91 | 85.87 | 85.81 | | 150 day SMA | 84.51 | 84.47 | 84.42 | | 200 day SMA | 84.76 | 84.75 | 84.74 |
|
|
