VanguardLong VGLT full analysis,charts,indicators,moving averages,SMA,DMA,EMA,ADX,MACD,RSIVanguard Long VGLT WideScreen charts, DMA,SMA,EMA technical analysis, forecast prediction, by indicators ADX,MACD,RSI,CCI NASDAQ stock exchange
operates under N A sector & deals in N A
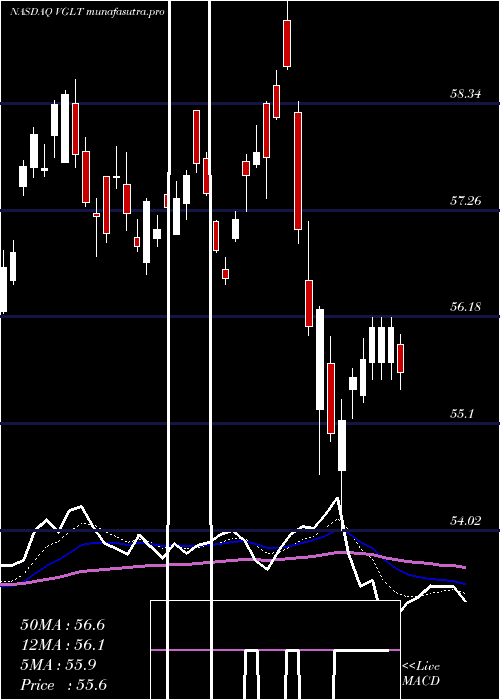
Daily price and charts and targets VanguardLong Strong Daily Stock price targets for VanguardLong VGLT are 56.01 and 56.37 | Daily Target 1 | 55.93 | | Daily Target 2 | 56.08 | | Daily Target 3 | 56.293333333333 | | Daily Target 4 | 56.44 | | Daily Target 5 | 56.65 |
Daily price and volume Vanguard Long
| Date |
Closing |
Open |
Range |
Volume |
Fri 05 December 2025 |
56.22 (-0.43%) |
56.46 |
56.15 - 56.51 |
0.7642 times |
Thu 04 December 2025 |
56.46 (-0.49%) |
56.64 |
56.41 - 56.66 |
0.7568 times |
Wed 03 December 2025 |
56.74 (0.25%) |
56.66 |
56.56 - 56.80 |
0.7805 times |
Tue 02 December 2025 |
56.60 (0.09%) |
56.44 |
56.38 - 56.65 |
0.9329 times |
Mon 01 December 2025 |
56.55 (-1.48%) |
56.62 |
56.52 - 56.69 |
1.6388 times |
Fri 28 November 2025 |
57.40 (-0.45%) |
57.59 |
57.27 - 57.60 |
1.0327 times |
Wed 26 November 2025 |
57.66 (0.35%) |
57.40 |
57.22 - 57.66 |
0.8336 times |
Tue 25 November 2025 |
57.46 (0.33%) |
57.47 |
57.39 - 57.64 |
1.1529 times |
Mon 24 November 2025 |
57.27 (0.49%) |
57.25 |
57.17 - 57.33 |
0.9154 times |
Fri 21 November 2025 |
56.99 (0.25%) |
57.10 |
56.84 - 57.12 |
1.1921 times |
Thu 20 November 2025 |
56.85 (0.35%) |
56.70 |
56.69 - 56.94 |
0.8025 times |
Weekly price and charts VanguardLong Strong weekly Stock price targets for VanguardLong VGLT are 55.86 and 56.51 | Weekly Target 1 | 55.74 | | Weekly Target 2 | 55.98 | | Weekly Target 3 | 56.39 | | Weekly Target 4 | 56.63 | | Weekly Target 5 | 57.04 |
Weekly price and volumes for Vanguard Long
| Date |
Closing |
Open |
Range |
Volume |
Fri 05 December 2025 |
56.22 (-2.06%) |
56.62 |
56.15 - 56.80 |
1.2019 times |
Fri 28 November 2025 |
57.40 (0.72%) |
57.25 |
57.17 - 57.66 |
0.9704 times |
Fri 21 November 2025 |
56.99 (0.69%) |
56.72 |
56.58 - 57.12 |
1.2508 times |
Fri 14 November 2025 |
56.60 (-0.65%) |
56.92 |
56.59 - 57.41 |
1.0498 times |
Fri 07 November 2025 |
56.97 (-0.73%) |
57.07 |
56.55 - 57.23 |
0.7691 times |
Fri 31 October 2025 |
57.39 (0%) |
57.52 |
57.33 - 57.57 |
0.3151 times |
Fri 31 October 2025 |
57.39 (-1.12%) |
57.95 |
57.33 - 58.43 |
1.6071 times |
Fri 24 October 2025 |
58.04 (0.31%) |
57.70 |
57.70 - 58.44 |
0.7884 times |
Fri 17 October 2025 |
57.86 (0.57%) |
57.35 |
57.11 - 58.06 |
1.1143 times |
Fri 10 October 2025 |
57.53 (1.32%) |
56.48 |
56.43 - 57.61 |
0.9332 times |
Fri 03 October 2025 |
56.78 (0.39%) |
56.80 |
56.69 - 57.22 |
1.1015 times |

Monthly price and charts VanguardLong Strong monthly Stock price targets for VanguardLong VGLT are 55.86 and 56.51 | Monthly Target 1 | 55.74 | | Monthly Target 2 | 55.98 | | Monthly Target 3 | 56.39 | | Monthly Target 4 | 56.63 | | Monthly Target 5 | 57.04 |
Monthly price and volumes Vanguard Long
| Date |
Closing |
Open |
Range |
Volume |
Fri 05 December 2025 |
56.22 (-2.06%) |
56.62 |
56.15 - 56.80 |
0.2275 times |
Fri 28 November 2025 |
57.40 (0.02%) |
57.07 |
56.55 - 57.66 |
0.7648 times |
Fri 31 October 2025 |
57.39 (0.93%) |
56.90 |
56.43 - 58.44 |
1.0309 times |
Tue 30 September 2025 |
56.86 (2.65%) |
54.78 |
54.70 - 57.84 |
1.0235 times |
Fri 29 August 2025 |
55.39 (-0.04%) |
55.75 |
54.89 - 56.30 |
1.0221 times |
Thu 31 July 2025 |
55.41 (-1.27%) |
56.01 |
53.77 - 56.13 |
1.055 times |
Mon 30 June 2025 |
56.12 (2.09%) |
54.35 |
54.07 - 56.22 |
0.8529 times |
Fri 30 May 2025 |
54.97 (-3.29%) |
56.64 |
53.18 - 56.70 |
1.2905 times |
Wed 30 April 2025 |
56.84 (-1.34%) |
57.72 |
54.02 - 59.46 |
1.6892 times |
Mon 31 March 2025 |
57.61 (-1.22%) |
57.74 |
56.51 - 58.57 |
1.0436 times |
Fri 28 February 2025 |
58.32 (4.76%) |
56.01 |
55.05 - 58.37 |
0.9775 times |

DMA SMA EMA moving averages of Vanguard Long VGLT
DMA (daily moving average) of Vanguard Long VGLT
| DMA period | DMA value | | 5 day DMA | 56.51 | | 12 day DMA | 56.9 | | 20 day DMA | 56.91 | | 35 day DMA | 57.27 | | 50 day DMA | 57.21 | | 100 day DMA | 56.51 | | 150 day DMA | 55.99 | | 200 day DMA | 56.21 | EMA (exponential moving average) of Vanguard Long VGLT
| EMA period | EMA current | EMA prev | EMA prev2 | | 5 day EMA | 56.56 | 56.73 | 56.86 | | 12 day EMA | 56.79 | 56.89 | 56.97 | | 20 day EMA | 56.92 | 56.99 | 57.05 | | 35 day EMA | 57 | 57.05 | 57.08 | | 50 day EMA | 57.08 | 57.12 | 57.15 |
SMA (simple moving average) of Vanguard Long VGLT
| SMA period | SMA current | SMA prev | SMA prev2 | | 5 day SMA | 56.51 | 56.75 | 56.99 | | 12 day SMA | 56.9 | 56.95 | 56.97 | | 20 day SMA | 56.91 | 56.95 | 56.96 | | 35 day SMA | 57.27 | 57.32 | 57.35 | | 50 day SMA | 57.21 | 57.22 | 57.22 | | 100 day SMA | 56.51 | 56.49 | 56.47 | | 150 day SMA | 55.99 | 55.99 | 56 | | 200 day SMA | 56.21 | 56.21 | 56.21 |
|
|
