VertexInc VERX full analysis,charts,indicators,moving averages,SMA,DMA,EMA,ADX,MACD,RSIVertex Inc VERX WideScreen charts, DMA,SMA,EMA technical analysis, forecast prediction, by indicators ADX,MACD,RSI,CCI NASDAQ stock exchange
Daily price and charts and targets VertexInc Strong Daily Stock price targets for VertexInc VERX are 35.37 and 37.34 | Daily Target 1 | 33.78 | | Daily Target 2 | 34.99 | | Daily Target 3 | 35.746666666667 | | Daily Target 4 | 36.96 | | Daily Target 5 | 37.72 |
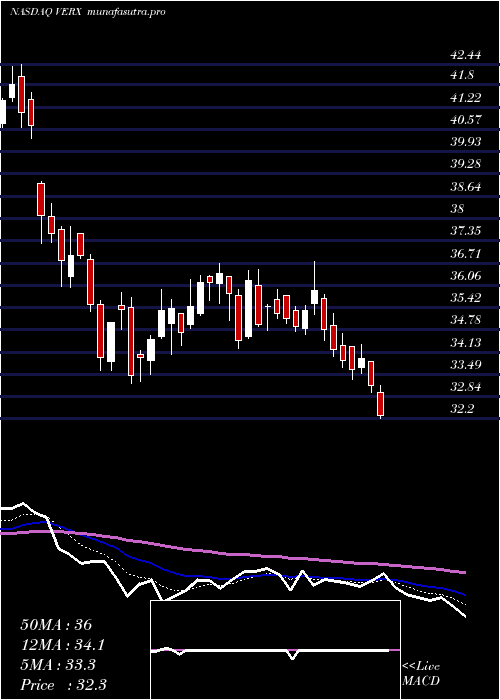
Daily price and volume Vertex Inc
| Date |
Closing |
Open |
Range |
Volume |
Mon 14 July 2025 |
36.21 (5.02%) |
34.59 |
34.53 - 36.50 |
1.8708 times |
Fri 11 July 2025 |
34.48 (-3.79%) |
35.78 |
34.24 - 35.93 |
0.8148 times |
Thu 10 July 2025 |
35.84 (-1.54%) |
36.31 |
35.05 - 36.31 |
0.6248 times |
Wed 09 July 2025 |
36.40 (0.69%) |
36.12 |
35.54 - 36.68 |
0.7723 times |
Tue 08 July 2025 |
36.15 (0%) |
36.31 |
35.63 - 36.36 |
0.6929 times |
Mon 07 July 2025 |
36.15 (1.97%) |
35.26 |
35.20 - 36.36 |
1.1928 times |
Thu 03 July 2025 |
35.45 (2.13%) |
34.93 |
34.82 - 36.23 |
0.4405 times |
Wed 02 July 2025 |
34.71 (-1.89%) |
35.25 |
34.33 - 35.25 |
0.8319 times |
Tue 01 July 2025 |
35.38 (0.11%) |
34.97 |
34.05 - 35.65 |
0.8555 times |
Mon 30 June 2025 |
35.34 (2.46%) |
34.58 |
34.53 - 35.93 |
1.9038 times |
Fri 27 June 2025 |
34.49 (1.47%) |
33.90 |
33.50 - 34.60 |
2.0939 times |
Weekly price and charts VertexInc Strong weekly Stock price targets for VertexInc VERX are 35.37 and 37.34 | Weekly Target 1 | 33.78 | | Weekly Target 2 | 34.99 | | Weekly Target 3 | 35.746666666667 | | Weekly Target 4 | 36.96 | | Weekly Target 5 | 37.72 |
Weekly price and volumes for Vertex Inc
| Date |
Closing |
Open |
Range |
Volume |
Mon 14 July 2025 |
36.21 (5.02%) |
34.59 |
34.53 - 36.50 |
0.4906 times |
Fri 11 July 2025 |
34.48 (-2.74%) |
35.26 |
34.24 - 36.68 |
1.0745 times |
Thu 03 July 2025 |
35.45 (2.78%) |
34.58 |
34.05 - 36.23 |
1.0572 times |
Fri 27 June 2025 |
34.49 (1.53%) |
33.87 |
33.22 - 35.86 |
1.8767 times |
Fri 20 June 2025 |
33.97 (-7.99%) |
37.56 |
33.59 - 37.56 |
1.0772 times |
Fri 13 June 2025 |
36.92 (-10.1%) |
41.43 |
36.00 - 41.63 |
1.5377 times |
Fri 06 June 2025 |
41.07 (3.79%) |
39.24 |
38.98 - 42.44 |
0.7184 times |
Fri 30 May 2025 |
39.57 (4.3%) |
38.47 |
38.07 - 40.13 |
0.7612 times |
Fri 23 May 2025 |
37.94 (-0.58%) |
37.99 |
37.67 - 39.29 |
0.6044 times |
Fri 16 May 2025 |
38.16 (-0.44%) |
39.32 |
36.56 - 39.80 |
0.8023 times |
Fri 09 May 2025 |
38.33 (-2.24%) |
38.94 |
36.14 - 39.79 |
1.0818 times |

Monthly price and charts VertexInc Strong monthly Stock price targets for VertexInc VERX are 35.13 and 37.76 | Monthly Target 1 | 33.02 | | Monthly Target 2 | 34.61 | | Monthly Target 3 | 35.646666666667 | | Monthly Target 4 | 37.24 | | Monthly Target 5 | 38.28 |
Monthly price and volumes Vertex Inc
| Date |
Closing |
Open |
Range |
Volume |
Mon 14 July 2025 |
36.21 (2.46%) |
34.97 |
34.05 - 36.68 |
0.5378 times |
Mon 30 June 2025 |
35.34 (-10.69%) |
39.24 |
33.22 - 42.44 |
1.4462 times |
Fri 30 May 2025 |
39.57 (-1.15%) |
40.42 |
36.14 - 40.77 |
0.9593 times |
Wed 30 April 2025 |
40.03 (14.34%) |
35.08 |
33.57 - 40.56 |
0.9985 times |
Mon 31 March 2025 |
35.01 (8.42%) |
32.34 |
30.26 - 36.83 |
1.5283 times |
Fri 28 February 2025 |
32.29 (-44.09%) |
56.12 |
32.01 - 60.71 |
1.3735 times |
Fri 31 January 2025 |
57.75 (8.25%) |
53.75 |
50.29 - 60.00 |
0.8242 times |
Tue 31 December 2024 |
53.35 (-3.26%) |
56.30 |
51.39 - 56.88 |
0.6404 times |
Tue 26 November 2024 |
55.15 (32.86%) |
41.75 |
41.51 - 55.52 |
0.9838 times |
Thu 31 October 2024 |
41.51 (7.79%) |
38.70 |
38.10 - 43.33 |
0.708 times |
Mon 30 September 2024 |
38.51 (-0.47%) |
38.37 |
34.66 - 38.66 |
0.5363 times |

DMA SMA EMA moving averages of Vertex Inc VERX
DMA (daily moving average) of Vertex Inc VERX
| DMA period | DMA value | | 5 day DMA | 35.82 | | 12 day DMA | 35.38 | | 20 day DMA | 35.43 | | 35 day DMA | 37.25 | | 50 day DMA | 37.61 | | 100 day DMA | 37.46 | | 150 day DMA | 43.12 | | 200 day DMA | 43.2 | EMA (exponential moving average) of Vertex Inc VERX
| EMA period | EMA current | EMA prev | EMA prev2 | | 5 day EMA | 35.68 | 35.42 | 35.89 | | 12 day EMA | 35.68 | 35.58 | 35.78 | | 20 day EMA | 36.02 | 36 | 36.16 | | 35 day EMA | 36.62 | 36.64 | 36.77 | | 50 day EMA | 37.59 | 37.65 | 37.78 |
SMA (simple moving average) of Vertex Inc VERX
| SMA period | SMA current | SMA prev | SMA prev2 | | 5 day SMA | 35.82 | 35.8 | 36 | | 12 day SMA | 35.38 | 35.15 | 35.23 | | 20 day SMA | 35.43 | 35.49 | 35.67 | | 35 day SMA | 37.25 | 37.32 | 37.43 | | 50 day SMA | 37.61 | 37.69 | 37.79 | | 100 day SMA | 37.46 | 37.56 | 37.67 | | 150 day SMA | 43.12 | 43.24 | 43.37 | | 200 day SMA | 43.2 | 43.2 | 43.21 |
|
|
