VeecoInstruments VECO full analysis,charts,indicators,moving averages,SMA,DMA,EMA,ADX,MACD,RSIVeeco Instruments VECO WideScreen charts, DMA,SMA,EMA technical analysis, forecast prediction, by indicators ADX,MACD,RSI,CCI NASDAQ stock exchange
operates under Technology sector & deals in Industrial Machinery Components
Daily price and charts and targets VeecoInstruments Strong Daily Stock price targets for VeecoInstruments VECO are 31.81 and 32.74 | Daily Target 1 | 31.11 | | Daily Target 2 | 31.58 | | Daily Target 3 | 32.04 | | Daily Target 4 | 32.51 | | Daily Target 5 | 32.97 |
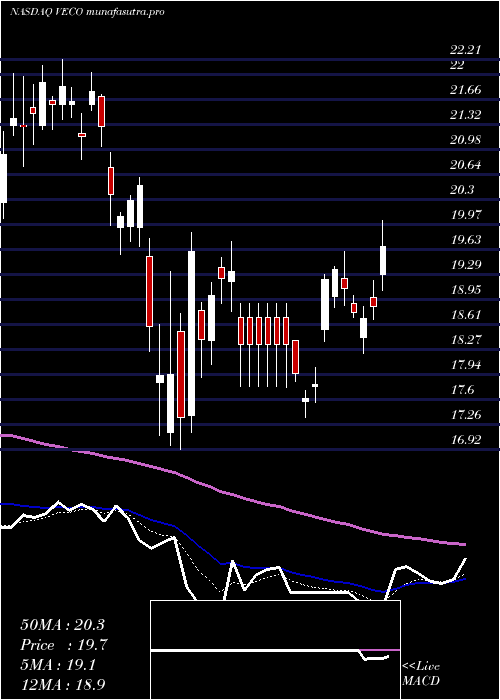
Daily price and volume Veeco Instruments
| Date |
Closing |
Open |
Range |
Volume |
Fri 05 December 2025 |
32.05 (1.78%) |
31.57 |
31.57 - 32.50 |
0.8966 times |
Thu 04 December 2025 |
31.49 (0.13%) |
31.45 |
30.91 - 31.82 |
1.2041 times |
Wed 03 December 2025 |
31.45 (8%) |
29.00 |
28.85 - 31.49 |
1.8132 times |
Tue 02 December 2025 |
29.12 (0.24%) |
29.10 |
28.76 - 29.41 |
0.8601 times |
Mon 01 December 2025 |
29.05 (-0.62%) |
28.92 |
28.71 - 29.27 |
0.7743 times |
Fri 28 November 2025 |
29.23 (0%) |
29.05 |
28.93 - 29.27 |
0.2964 times |
Wed 26 November 2025 |
29.23 (0.03%) |
29.37 |
29.14 - 29.87 |
1.2185 times |
Tue 25 November 2025 |
29.22 (4.13%) |
28.05 |
27.99 - 29.52 |
0.9878 times |
Mon 24 November 2025 |
28.06 (2.41%) |
27.38 |
27.38 - 28.24 |
0.8661 times |
Fri 21 November 2025 |
27.40 (3.83%) |
26.31 |
26.31 - 27.86 |
1.0829 times |
Thu 20 November 2025 |
26.39 (-4.11%) |
28.18 |
26.00 - 28.27 |
1.2027 times |
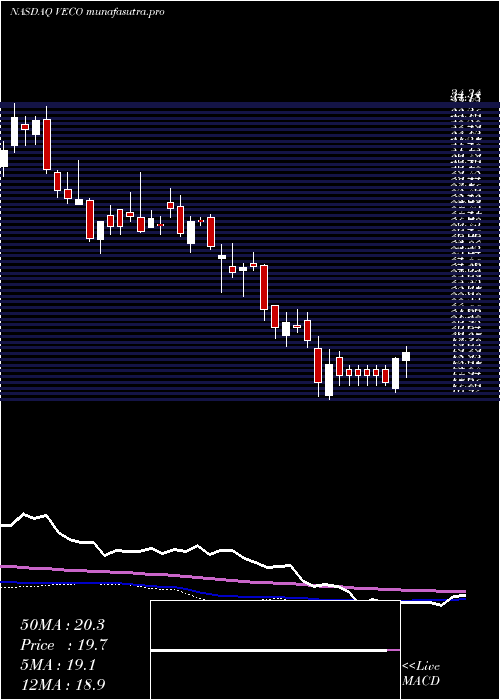
Weekly price and charts VeecoInstruments Strong weekly Stock price targets for VeecoInstruments VECO are 30.38 and 34.17 | Weekly Target 1 | 27.3 | | Weekly Target 2 | 29.67 | | Weekly Target 3 | 31.086666666667 | | Weekly Target 4 | 33.46 | | Weekly Target 5 | 34.88 |
Weekly price and volumes for Veeco Instruments
| Date |
Closing |
Open |
Range |
Volume |
Fri 05 December 2025 |
32.05 (9.65%) |
28.92 |
28.71 - 32.50 |
0.8543 times |
Fri 28 November 2025 |
29.23 (6.68%) |
27.38 |
27.38 - 29.87 |
0.5187 times |
Fri 21 November 2025 |
27.40 (-6.1%) |
29.12 |
26.00 - 29.45 |
0.7675 times |
Fri 14 November 2025 |
29.18 (-4.04%) |
31.03 |
27.61 - 31.68 |
1.3667 times |
Fri 07 November 2025 |
30.41 (5.77%) |
30.30 |
28.50 - 30.51 |
1.3111 times |
Fri 31 October 2025 |
28.75 (0%) |
29.11 |
28.33 - 29.27 |
0.1502 times |
Fri 31 October 2025 |
28.75 (-1.91%) |
29.93 |
28.33 - 30.02 |
0.9553 times |
Fri 24 October 2025 |
29.31 (0.45%) |
29.26 |
27.66 - 30.09 |
0.9331 times |
Fri 17 October 2025 |
29.18 (5%) |
28.56 |
27.62 - 30.04 |
1.4926 times |
Fri 10 October 2025 |
27.79 (-12.08%) |
31.61 |
27.77 - 32.84 |
1.6505 times |
Fri 03 October 2025 |
31.61 (5.83%) |
29.90 |
29.50 - 34.45 |
2.1656 times |
Monthly price and charts VeecoInstruments Strong monthly Stock price targets for VeecoInstruments VECO are 30.38 and 34.17 | Monthly Target 1 | 27.3 | | Monthly Target 2 | 29.67 | | Monthly Target 3 | 31.086666666667 | | Monthly Target 4 | 33.46 | | Monthly Target 5 | 34.88 |
Monthly price and volumes Veeco Instruments
| Date |
Closing |
Open |
Range |
Volume |
Fri 05 December 2025 |
32.05 (9.65%) |
28.92 |
28.71 - 32.50 |
0.2042 times |
Fri 28 November 2025 |
29.23 (1.67%) |
30.30 |
26.00 - 31.68 |
0.9473 times |
Fri 31 October 2025 |
28.75 (-5.52%) |
32.27 |
27.62 - 34.45 |
1.6733 times |
Tue 30 September 2025 |
30.43 (24.1%) |
23.81 |
23.31 - 30.84 |
1.1025 times |
Fri 29 August 2025 |
24.52 (18%) |
20.28 |
19.29 - 25.42 |
1.4405 times |
Thu 31 July 2025 |
20.78 (2.26%) |
20.15 |
19.92 - 22.30 |
0.8214 times |
Mon 30 June 2025 |
20.32 (5.23%) |
19.23 |
19.04 - 22.10 |
0.8643 times |
Fri 30 May 2025 |
19.31 (3.26%) |
18.98 |
18.31 - 21.52 |
0.9611 times |
Wed 30 April 2025 |
18.70 (-6.87%) |
19.94 |
16.92 - 20.61 |
1.0003 times |
Mon 31 March 2025 |
20.08 (-9.71%) |
22.48 |
19.57 - 22.48 |
0.9852 times |
Fri 28 February 2025 |
22.24 (-12.37%) |
24.75 |
21.59 - 26.11 |
0.9515 times |
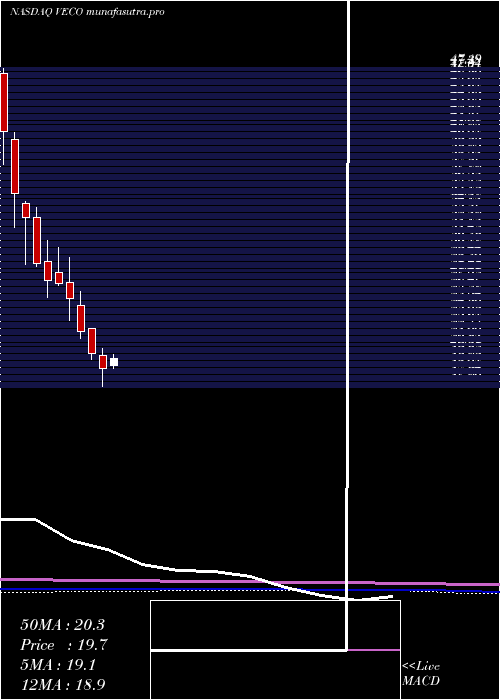
DMA SMA EMA moving averages of Veeco Instruments VECO
DMA (daily moving average) of Veeco Instruments VECO
| DMA period | DMA value | | 5 day DMA | 30.63 | | 12 day DMA | 29.18 | | 20 day DMA | 29.35 | | 35 day DMA | 29.27 | | 50 day DMA | 29.5 | | 100 day DMA | 26.82 | | 150 day DMA | 24.69 | | 200 day DMA | 23.54 | EMA (exponential moving average) of Veeco Instruments VECO
| EMA period | EMA current | EMA prev | EMA prev2 | | 5 day EMA | 30.92 | 30.35 | 29.78 | | 12 day EMA | 29.93 | 29.55 | 29.2 | | 20 day EMA | 29.61 | 29.35 | 29.12 | | 35 day EMA | 29.51 | 29.36 | 29.23 | | 50 day EMA | 29.6 | 29.5 | 29.42 |
SMA (simple moving average) of Veeco Instruments VECO
| SMA period | SMA current | SMA prev | SMA prev2 | | 5 day SMA | 30.63 | 30.07 | 29.62 | | 12 day SMA | 29.18 | 28.79 | 28.55 | | 20 day SMA | 29.35 | 29.2 | 29.1 | | 35 day SMA | 29.27 | 29.16 | 29.09 | | 50 day SMA | 29.5 | 29.45 | 29.41 | | 100 day SMA | 26.82 | 26.71 | 26.6 | | 150 day SMA | 24.69 | 24.6 | 24.52 | | 200 day SMA | 23.54 | 23.5 | 23.47 |
|
|
