VericelCorporation VCEL full analysis,charts,indicators,moving averages,SMA,DMA,EMA,ADX,MACD,RSIVericel Corporation VCEL WideScreen charts, DMA,SMA,EMA technical analysis, forecast prediction, by indicators ADX,MACD,RSI,CCI NASDAQ stock exchange
operates under Health Care sector & deals in Biotechnology Biological Products No Diagnostic Substances
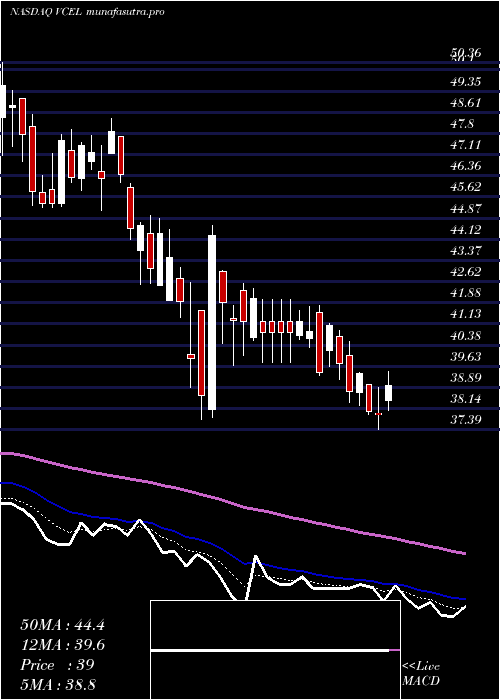
Daily price and charts and targets VericelCorporation Strong Daily Stock price targets for VericelCorporation VCEL are 35.47 and 36.62 | Daily Target 1 | 35.21 | | Daily Target 2 | 35.72 | | Daily Target 3 | 36.36 | | Daily Target 4 | 36.87 | | Daily Target 5 | 37.51 |
Daily price and volume Vericel Corporation
| Date |
Closing |
Open |
Range |
Volume |
Fri 05 December 2025 |
36.23 (-1.52%) |
36.75 |
35.85 - 37.00 |
0.5449 times |
Thu 04 December 2025 |
36.79 (-1.6%) |
37.20 |
36.47 - 37.29 |
0.7584 times |
Wed 03 December 2025 |
37.39 (-0.69%) |
37.81 |
37.35 - 38.19 |
1.1899 times |
Tue 02 December 2025 |
37.65 (-3.01%) |
39.14 |
37.32 - 39.14 |
1.0136 times |
Mon 01 December 2025 |
38.82 (-3.55%) |
39.78 |
38.73 - 40.43 |
0.6545 times |
Fri 28 November 2025 |
40.25 (-0.3%) |
40.60 |
39.87 - 40.60 |
0.2851 times |
Wed 26 November 2025 |
40.37 (-5.1%) |
42.09 |
40.09 - 42.68 |
1.0305 times |
Tue 25 November 2025 |
42.54 (9.41%) |
39.41 |
39.29 - 42.64 |
1.6269 times |
Mon 24 November 2025 |
38.88 (-1.77%) |
39.60 |
38.33 - 40.13 |
1.8074 times |
Fri 21 November 2025 |
39.58 (4.57%) |
37.91 |
37.82 - 40.11 |
1.0888 times |
Thu 20 November 2025 |
37.85 (-2.82%) |
39.51 |
37.51 - 39.86 |
0.6249 times |
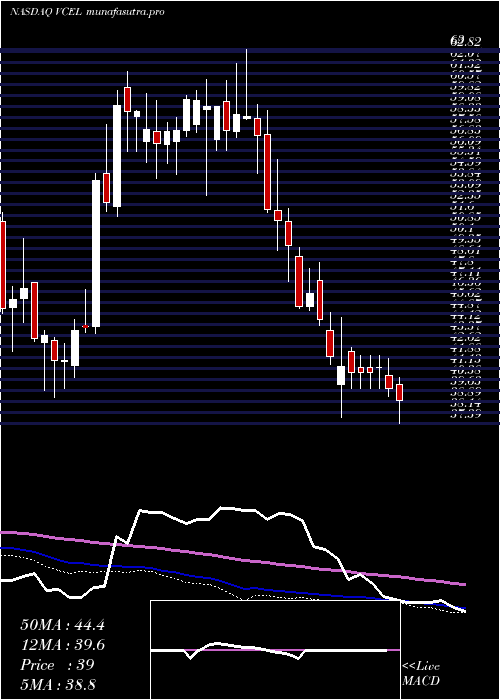
Weekly price and charts VericelCorporation Strong weekly Stock price targets for VericelCorporation VCEL are 33.75 and 38.33 | Weekly Target 1 | 32.92 | | Weekly Target 2 | 34.58 | | Weekly Target 3 | 37.503333333333 | | Weekly Target 4 | 39.16 | | Weekly Target 5 | 42.08 |
Weekly price and volumes for Vericel Corporation
| Date |
Closing |
Open |
Range |
Volume |
Fri 05 December 2025 |
36.23 (-9.99%) |
39.78 |
35.85 - 40.43 |
0.976 times |
Fri 28 November 2025 |
40.25 (1.69%) |
39.60 |
38.33 - 42.68 |
1.114 times |
Fri 21 November 2025 |
39.58 (-0.7%) |
39.82 |
37.51 - 40.39 |
0.8346 times |
Fri 14 November 2025 |
39.86 (2.36%) |
39.71 |
38.01 - 41.66 |
0.9534 times |
Fri 07 November 2025 |
38.94 (11.07%) |
36.25 |
35.44 - 43.00 |
1.6817 times |
Fri 31 October 2025 |
35.06 (0%) |
34.48 |
33.76 - 35.64 |
0.231 times |
Fri 31 October 2025 |
35.06 (-3.47%) |
36.35 |
33.76 - 36.99 |
0.9545 times |
Fri 24 October 2025 |
36.32 (2.83%) |
35.75 |
35.23 - 36.95 |
0.8277 times |
Fri 17 October 2025 |
35.32 (10.89%) |
32.21 |
31.63 - 35.76 |
1.5062 times |
Fri 10 October 2025 |
31.85 (-1.82%) |
32.53 |
31.34 - 34.55 |
0.9209 times |
Fri 03 October 2025 |
32.44 (7.31%) |
30.28 |
29.88 - 33.24 |
1.1688 times |
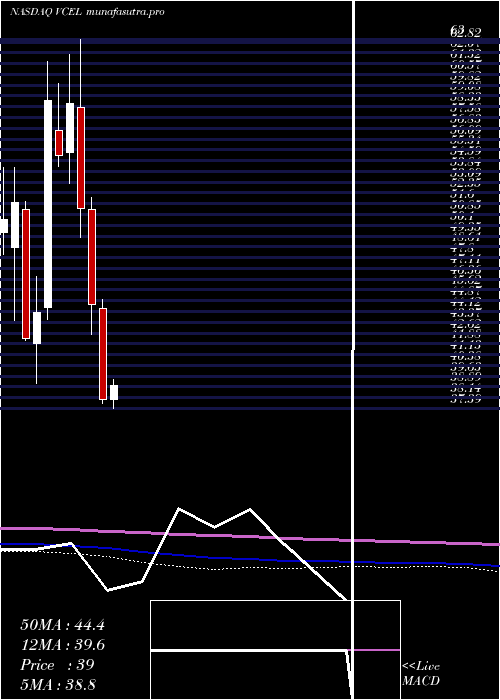
Monthly price and charts VericelCorporation Strong monthly Stock price targets for VericelCorporation VCEL are 33.75 and 38.33 | Monthly Target 1 | 32.92 | | Monthly Target 2 | 34.58 | | Monthly Target 3 | 37.503333333333 | | Monthly Target 4 | 39.16 | | Monthly Target 5 | 42.08 |
Monthly price and volumes Vericel Corporation
| Date |
Closing |
Open |
Range |
Volume |
Fri 05 December 2025 |
36.23 (-9.99%) |
39.78 |
35.85 - 40.43 |
0.2348 times |
Fri 28 November 2025 |
40.25 (14.8%) |
36.25 |
35.44 - 43.00 |
1.1029 times |
Fri 31 October 2025 |
35.06 (11.41%) |
31.33 |
30.50 - 36.99 |
1.2005 times |
Tue 30 September 2025 |
31.47 (-13.45%) |
35.77 |
29.24 - 36.61 |
1.7716 times |
Fri 29 August 2025 |
36.36 (4.06%) |
34.38 |
33.09 - 38.08 |
0.9822 times |
Thu 31 July 2025 |
34.94 (-17.88%) |
41.90 |
34.87 - 43.51 |
1.1398 times |
Mon 30 June 2025 |
42.55 (3.03%) |
41.13 |
39.16 - 45.97 |
0.7906 times |
Fri 30 May 2025 |
41.30 (8.63%) |
37.98 |
37.39 - 44.41 |
1.0747 times |
Wed 30 April 2025 |
38.02 (-14.79%) |
44.34 |
37.76 - 44.97 |
0.9657 times |
Mon 31 March 2025 |
44.62 (-13%) |
51.20 |
42.53 - 52.06 |
0.7371 times |
Fri 28 February 2025 |
51.29 (-12.38%) |
58.25 |
49.22 - 63.00 |
0.6256 times |
DMA SMA EMA moving averages of Vericel Corporation VCEL
DMA (daily moving average) of Vericel Corporation VCEL
| DMA period | DMA value | | 5 day DMA | 37.38 | | 12 day DMA | 38.78 | | 20 day DMA | 39.14 | | 35 day DMA | 37.84 | | 50 day DMA | 36.3 | | 100 day DMA | 35.77 | | 150 day DMA | 37.71 | | 200 day DMA | 39.53 | EMA (exponential moving average) of Vericel Corporation VCEL
| EMA period | EMA current | EMA prev | EMA prev2 | | 5 day EMA | 37.36 | 37.93 | 38.5 | | 12 day EMA | 38.24 | 38.61 | 38.94 | | 20 day EMA | 38.23 | 38.44 | 38.61 | | 35 day EMA | 37.31 | 37.37 | 37.4 | | 50 day EMA | 35.95 | 35.94 | 35.91 |
SMA (simple moving average) of Vericel Corporation VCEL
| SMA period | SMA current | SMA prev | SMA prev2 | | 5 day SMA | 37.38 | 38.18 | 38.9 | | 12 day SMA | 38.78 | 39.01 | 39.23 | | 20 day SMA | 39.14 | 39.27 | 39.29 | | 35 day SMA | 37.84 | 37.8 | 37.71 | | 50 day SMA | 36.3 | 36.17 | 36.04 | | 100 day SMA | 35.77 | 35.78 | 35.78 | | 150 day SMA | 37.71 | 37.72 | 37.73 | | 200 day SMA | 39.53 | 39.63 | 39.74 |
|
|
