US USAU full analysis,charts,indicators,moving averages,SMA,DMA,EMA,ADX,MACD,RSIU S USAU WideScreen charts, DMA,SMA,EMA technical analysis, forecast prediction, by indicators ADX,MACD,RSI,CCI NASDAQ stock exchange
operates under N A sector & deals in N A
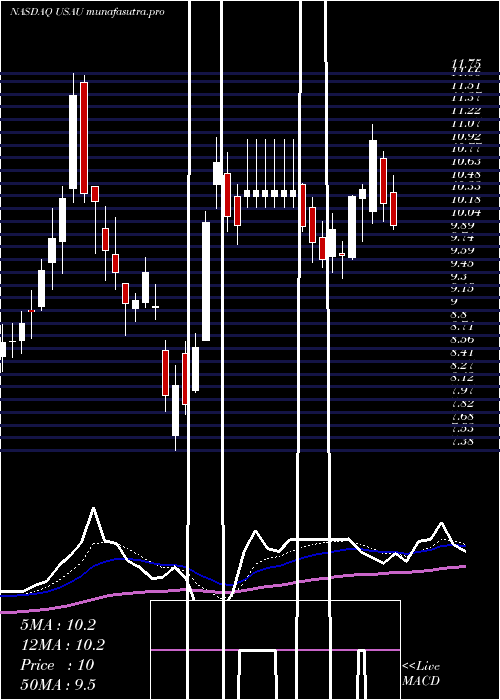
Daily price and charts and targets US Strong Daily Stock price targets for US USAU are 10.87 and 11.33 | Daily Target 1 | 10.76 | | Daily Target 2 | 10.97 | | Daily Target 3 | 11.22 | | Daily Target 4 | 11.43 | | Daily Target 5 | 11.68 |
Daily price and volume U S
| Date |
Closing |
Open |
Range |
Volume |
Wed 16 July 2025 |
11.18 (-2.44%) |
11.47 |
11.01 - 11.47 |
0.891 times |
Tue 15 July 2025 |
11.46 (-5.29%) |
12.10 |
11.29 - 12.16 |
1.3501 times |
Mon 14 July 2025 |
12.10 (-1.22%) |
12.29 |
12.00 - 12.66 |
0.9845 times |
Fri 11 July 2025 |
12.25 (0.25%) |
12.30 |
12.11 - 12.57 |
0.8929 times |
Thu 10 July 2025 |
12.22 (0.74%) |
12.24 |
12.05 - 12.45 |
0.7247 times |
Wed 09 July 2025 |
12.13 (-1.14%) |
12.27 |
11.92 - 12.27 |
0.7739 times |
Tue 08 July 2025 |
12.27 (-4.29%) |
12.90 |
11.81 - 12.90 |
1.7372 times |
Mon 07 July 2025 |
12.82 (1.1%) |
12.57 |
11.95 - 12.90 |
0.8926 times |
Thu 03 July 2025 |
12.68 (-1.25%) |
12.68 |
12.44 - 12.85 |
0.5109 times |
Wed 02 July 2025 |
12.84 (2.97%) |
12.65 |
12.50 - 13.20 |
1.2421 times |
Tue 01 July 2025 |
12.47 (2.21%) |
12.34 |
12.00 - 12.63 |
1.263 times |
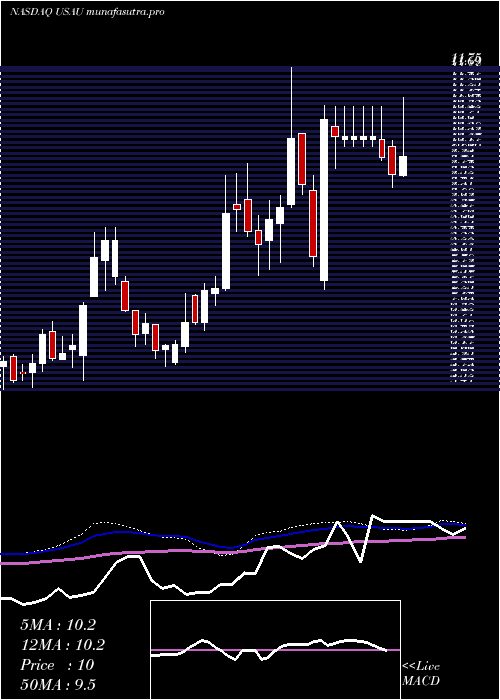
Weekly price and charts US Strong weekly Stock price targets for US USAU are 10.27 and 11.92 | Weekly Target 1 | 9.97 | | Weekly Target 2 | 10.57 | | Weekly Target 3 | 11.616666666667 | | Weekly Target 4 | 12.22 | | Weekly Target 5 | 13.27 |
Weekly price and volumes for U S
| Date |
Closing |
Open |
Range |
Volume |
Wed 16 July 2025 |
11.18 (-8.73%) |
12.29 |
11.01 - 12.66 |
0.5904 times |
Fri 11 July 2025 |
12.25 (-3.39%) |
12.57 |
11.81 - 12.90 |
0.9191 times |
Thu 03 July 2025 |
12.68 (4.11%) |
12.17 |
11.91 - 13.20 |
0.8225 times |
Fri 27 June 2025 |
12.18 (-0.25%) |
12.21 |
11.62 - 13.15 |
1.8024 times |
Fri 20 June 2025 |
12.21 (-8.74%) |
12.75 |
11.86 - 12.92 |
0.5946 times |
Fri 13 June 2025 |
13.38 (-5.17%) |
14.08 |
12.81 - 14.09 |
1.2809 times |
Fri 06 June 2025 |
14.11 (21.95%) |
12.05 |
11.93 - 14.39 |
1.7838 times |
Fri 30 May 2025 |
11.57 (7.33%) |
10.74 |
10.70 - 11.60 |
0.5494 times |
Fri 23 May 2025 |
10.78 (5.07%) |
10.48 |
10.40 - 11.25 |
0.5785 times |
Fri 16 May 2025 |
10.26 (-14.29%) |
11.55 |
9.75 - 11.55 |
1.0784 times |
Fri 09 May 2025 |
11.97 (19.82%) |
10.25 |
9.56 - 12.00 |
1.7936 times |
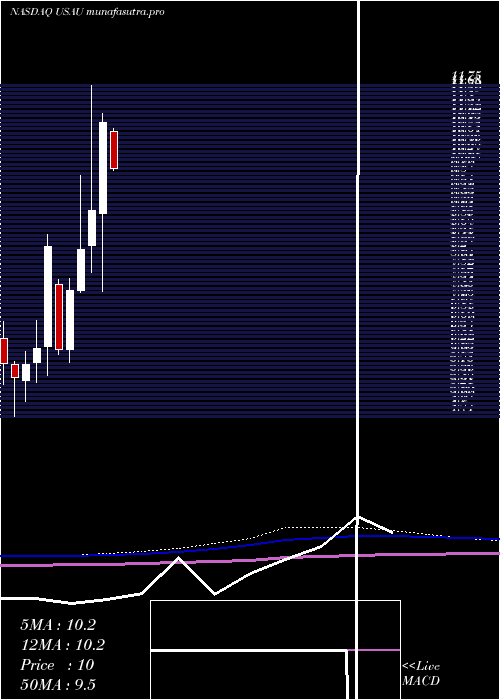
Monthly price and charts US Strong monthly Stock price targets for US USAU are 10 and 12.19 | Monthly Target 1 | 9.61 | | Monthly Target 2 | 10.39 | | Monthly Target 3 | 11.796666666667 | | Monthly Target 4 | 12.58 | | Monthly Target 5 | 13.99 |
Monthly price and volumes U S
| Date |
Closing |
Open |
Range |
Volume |
Wed 16 July 2025 |
11.18 (-8.36%) |
12.34 |
11.01 - 13.20 |
0.6947 times |
Mon 30 June 2025 |
12.20 (5.45%) |
12.05 |
11.62 - 14.39 |
1.9316 times |
Fri 30 May 2025 |
11.57 (5.47%) |
10.77 |
9.56 - 12.00 |
1.4522 times |
Wed 30 April 2025 |
10.97 (20.68%) |
9.03 |
7.38 - 11.16 |
1.3891 times |
Mon 31 March 2025 |
9.09 (10.05%) |
8.35 |
7.77 - 11.75 |
1.269 times |
Fri 28 February 2025 |
8.26 (11.77%) |
7.39 |
7.35 - 9.85 |
1.083 times |
Fri 31 January 2025 |
7.39 (20.55%) |
6.13 |
5.86 - 7.64 |
0.564 times |
Tue 31 December 2024 |
6.13 (-26.5%) |
7.53 |
6.02 - 7.63 |
0.3977 times |
Tue 26 November 2024 |
8.34 (35.61%) |
6.20 |
5.59 - 8.59 |
0.8129 times |
Thu 31 October 2024 |
6.15 (5.85%) |
5.87 |
5.44 - 6.75 |
0.4058 times |
Mon 30 September 2024 |
5.81 (4.87%) |
5.48 |
5.04 - 6.10 |
0.3568 times |
DMA SMA EMA moving averages of U S USAU
DMA (daily moving average) of U S USAU
| DMA period | DMA value | | 5 day DMA | 11.84 | | 12 day DMA | 12.22 | | 20 day DMA | 12.29 | | 35 day DMA | 12.43 | | 50 day DMA | 11.86 | | 100 day DMA | 10.64 | | 150 day DMA | 9.54 | | 200 day DMA | 8.75 | EMA (exponential moving average) of U S USAU
| EMA period | EMA current | EMA prev | EMA prev2 | | 5 day EMA | 11.71 | 11.98 | 12.24 | | 12 day EMA | 12.08 | 12.24 | 12.38 | | 20 day EMA | 12.18 | 12.29 | 12.38 | | 35 day EMA | 11.94 | 11.99 | 12.02 | | 50 day EMA | 11.72 | 11.74 | 11.75 |
SMA (simple moving average) of U S USAU
| SMA period | SMA current | SMA prev | SMA prev2 | | 5 day SMA | 11.84 | 12.03 | 12.19 | | 12 day SMA | 12.22 | 12.3 | 12.43 | | 20 day SMA | 12.29 | 12.4 | 12.49 | | 35 day SMA | 12.43 | 12.4 | 12.38 | | 50 day SMA | 11.86 | 11.84 | 11.83 | | 100 day SMA | 10.64 | 10.61 | 10.58 | | 150 day SMA | 9.54 | 9.51 | 9.48 | | 200 day SMA | 8.75 | 8.72 | 8.69 |
|
|
