TexasInstruments TXN full analysis,charts,indicators,moving averages,SMA,DMA,EMA,ADX,MACD,RSITexas Instruments TXN WideScreen charts, DMA,SMA,EMA technical analysis, forecast prediction, by indicators ADX,MACD,RSI,CCI NASDAQ stock exchange
operates under Technology sector & deals in Semiconductors
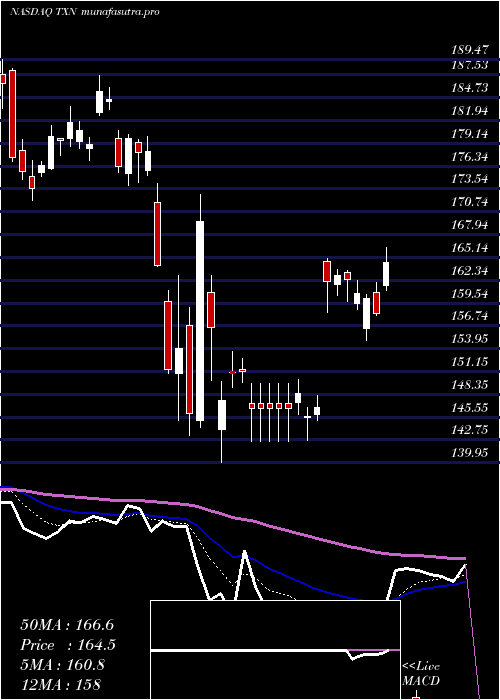
Daily price and charts and targets TexasInstruments Strong Daily Stock price targets for TexasInstruments TXN are 181.59 and 185.72 | Daily Target 1 | 178.51 | | Daily Target 2 | 180.53 | | Daily Target 3 | 182.64333333333 | | Daily Target 4 | 184.66 | | Daily Target 5 | 186.77 |
Daily price and volume Texas Instruments
| Date |
Closing |
Open |
Range |
Volume |
Fri 05 December 2025 |
182.54 (1.33%) |
180.87 |
180.63 - 184.76 |
0.8885 times |
Thu 04 December 2025 |
180.15 (-1.34%) |
181.94 |
178.94 - 183.91 |
0.3696 times |
Wed 03 December 2025 |
182.60 (4.19%) |
176.82 |
175.58 - 183.00 |
1.2493 times |
Tue 02 December 2025 |
175.26 (4.22%) |
168.71 |
168.01 - 177.88 |
1.2735 times |
Mon 01 December 2025 |
168.16 (-0.07%) |
166.84 |
166.53 - 169.66 |
0.8326 times |
Fri 28 November 2025 |
168.27 (1.77%) |
166.04 |
165.42 - 169.25 |
0.5421 times |
Wed 26 November 2025 |
165.35 (2.21%) |
162.32 |
162.05 - 167.04 |
0.9912 times |
Tue 25 November 2025 |
161.77 (0.32%) |
159.72 |
158.69 - 161.95 |
0.9994 times |
Mon 24 November 2025 |
161.26 (1.17%) |
159.71 |
158.97 - 162.70 |
1.2772 times |
Fri 21 November 2025 |
159.40 (3.96%) |
153.42 |
153.41 - 161.16 |
1.5765 times |
Thu 20 November 2025 |
153.33 (-2.39%) |
158.16 |
152.73 - 159.25 |
1.0647 times |
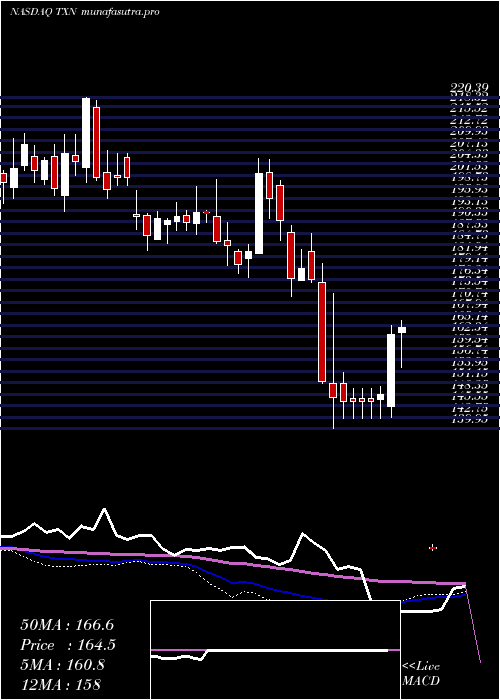
Weekly price and charts TexasInstruments Strong weekly Stock price targets for TexasInstruments TXN are 174.54 and 192.77 | Weekly Target 1 | 159.71 | | Weekly Target 2 | 171.13 | | Weekly Target 3 | 177.94333333333 | | Weekly Target 4 | 189.36 | | Weekly Target 5 | 196.17 |
Weekly price and volumes for Texas Instruments
| Date |
Closing |
Open |
Range |
Volume |
Fri 05 December 2025 |
182.54 (8.48%) |
166.84 |
166.53 - 184.76 |
1.0371 times |
Fri 28 November 2025 |
168.27 (5.56%) |
159.71 |
158.69 - 169.25 |
0.8565 times |
Fri 21 November 2025 |
159.40 (0.04%) |
158.63 |
152.73 - 161.16 |
1.233 times |
Fri 14 November 2025 |
159.33 (-0.76%) |
162.00 |
158.30 - 165.43 |
0.9607 times |
Fri 07 November 2025 |
160.55 (-0.56%) |
161.18 |
156.89 - 165.62 |
0.9058 times |
Fri 31 October 2025 |
161.46 (0%) |
158.36 |
157.80 - 162.00 |
0.2641 times |
Fri 31 October 2025 |
161.46 (-4.52%) |
169.82 |
157.80 - 170.37 |
1.468 times |
Fri 24 October 2025 |
169.11 (-4.42%) |
175.51 |
163.04 - 181.84 |
1.2402 times |
Fri 17 October 2025 |
176.93 (3.05%) |
172.83 |
171.13 - 177.63 |
1.1116 times |
Fri 10 October 2025 |
171.70 (-4.8%) |
181.20 |
171.50 - 183.23 |
0.9228 times |
Fri 03 October 2025 |
180.35 (-2.28%) |
185.47 |
178.33 - 186.10 |
0.7533 times |
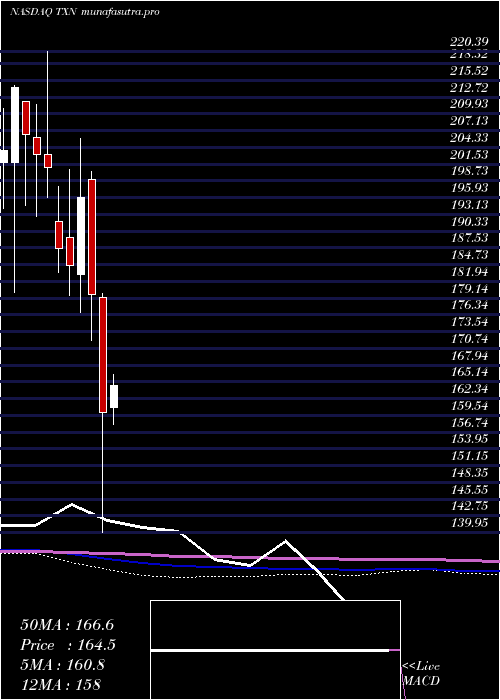
Monthly price and charts TexasInstruments Strong monthly Stock price targets for TexasInstruments TXN are 174.54 and 192.77 | Monthly Target 1 | 159.71 | | Monthly Target 2 | 171.13 | | Monthly Target 3 | 177.94333333333 | | Monthly Target 4 | 189.36 | | Monthly Target 5 | 196.17 |
Monthly price and volumes Texas Instruments
| Date |
Closing |
Open |
Range |
Volume |
Fri 05 December 2025 |
182.54 (8.48%) |
166.84 |
166.53 - 184.76 |
0.2456 times |
Fri 28 November 2025 |
168.27 (4.22%) |
161.18 |
152.73 - 169.25 |
0.9368 times |
Fri 31 October 2025 |
161.46 (-12.12%) |
181.97 |
157.80 - 185.46 |
1.2996 times |
Tue 30 September 2025 |
183.73 (-9.26%) |
199.38 |
174.01 - 200.17 |
1.1331 times |
Fri 29 August 2025 |
202.48 (11.83%) |
179.63 |
177.92 - 209.09 |
0.8625 times |
Thu 31 July 2025 |
181.06 (-12.79%) |
207.00 |
179.81 - 221.69 |
1.1766 times |
Mon 30 June 2025 |
207.62 (13.55%) |
181.85 |
181.61 - 208.38 |
0.8021 times |
Fri 30 May 2025 |
182.85 (14.25%) |
160.84 |
158.06 - 189.90 |
1.1078 times |
Wed 30 April 2025 |
160.05 (-10.93%) |
179.28 |
139.95 - 179.93 |
1.5453 times |
Mon 31 March 2025 |
179.70 (-8.31%) |
199.01 |
172.09 - 200.25 |
0.8905 times |
Fri 28 February 2025 |
195.99 (6.16%) |
183.03 |
176.76 - 205.75 |
0.8364 times |
DMA SMA EMA moving averages of Texas Instruments TXN
DMA (daily moving average) of Texas Instruments TXN
| DMA period | DMA value | | 5 day DMA | 177.74 | | 12 day DMA | 167.93 | | 20 day DMA | 164.65 | | 35 day DMA | 165.9 | | 50 day DMA | 169.82 | | 100 day DMA | 180.87 | | 150 day DMA | 185.5 | | 200 day DMA | 181.91 | EMA (exponential moving average) of Texas Instruments TXN
| EMA period | EMA current | EMA prev | EMA prev2 | | 5 day EMA | 177.89 | 175.56 | 173.27 | | 12 day EMA | 171.44 | 169.42 | 167.47 | | 20 day EMA | 168.81 | 167.37 | 166.02 | | 35 day EMA | 169.37 | 168.59 | 167.91 | | 50 day EMA | 171.62 | 171.17 | 170.8 |
SMA (simple moving average) of Texas Instruments TXN
| SMA period | SMA current | SMA prev | SMA prev2 | | 5 day SMA | 177.74 | 174.89 | 171.93 | | 12 day SMA | 167.93 | 165.83 | 163.73 | | 20 day SMA | 164.65 | 163.59 | 162.76 | | 35 day SMA | 165.9 | 165.68 | 165.54 | | 50 day SMA | 169.82 | 169.81 | 169.9 | | 100 day SMA | 180.87 | 181.21 | 181.6 | | 150 day SMA | 185.5 | 185.34 | 185.21 | | 200 day SMA | 181.91 | 182.02 | 182.1 |
|
|
