TowersWatson TW full analysis,charts,indicators,moving averages,SMA,DMA,EMA,ADX,MACD,RSITowers Watson TW WideScreen charts, DMA,SMA,EMA technical analysis, forecast prediction, by indicators ADX,MACD,RSI,CCI NASDAQ stock exchange
operates under Consumer Services sector & deals in Professional Services
Daily price and charts and targets TowersWatson Strong Daily Stock price targets for TowersWatson TW are 107.17 and 108.51 | Daily Target 1 | 106.07 | | Daily Target 2 | 106.92 | | Daily Target 3 | 107.41 | | Daily Target 4 | 108.26 | | Daily Target 5 | 108.75 |
Daily price and volume Towers Watson
| Date |
Closing |
Open |
Range |
Volume |
Fri 05 December 2025 |
107.77 (-0.13%) |
107.33 |
106.56 - 107.90 |
0.7354 times |
Thu 04 December 2025 |
107.91 (-0.14%) |
109.23 |
106.91 - 109.64 |
0.9789 times |
Wed 03 December 2025 |
108.06 (1.69%) |
106.93 |
106.47 - 108.54 |
1.2098 times |
Tue 02 December 2025 |
106.26 (-0.5%) |
106.78 |
106.15 - 107.65 |
0.7799 times |
Mon 01 December 2025 |
106.79 (-1.9%) |
108.21 |
105.96 - 108.77 |
1.028 times |
Fri 28 November 2025 |
108.86 (0.87%) |
108.11 |
107.76 - 109.48 |
0.4056 times |
Wed 26 November 2025 |
107.92 (0.39%) |
107.72 |
107.26 - 108.58 |
0.7767 times |
Tue 25 November 2025 |
107.50 (2.28%) |
105.26 |
105.01 - 107.66 |
1.2317 times |
Mon 24 November 2025 |
105.10 (-1.28%) |
106.70 |
105.00 - 106.97 |
1.5195 times |
Fri 21 November 2025 |
106.46 (-0.33%) |
107.32 |
105.82 - 107.63 |
1.3345 times |
Thu 20 November 2025 |
106.81 (-0.58%) |
108.16 |
106.49 - 108.57 |
1.3218 times |
Weekly price and charts TowersWatson Strong weekly Stock price targets for TowersWatson TW are 105.03 and 108.71 | Weekly Target 1 | 104.11 | | Weekly Target 2 | 105.94 | | Weekly Target 3 | 107.79 | | Weekly Target 4 | 109.62 | | Weekly Target 5 | 111.47 |
Weekly price and volumes for Towers Watson
| Date |
Closing |
Open |
Range |
Volume |
Fri 05 December 2025 |
107.77 (-1%) |
108.21 |
105.96 - 109.64 |
0.8064 times |
Fri 28 November 2025 |
108.86 (2.25%) |
106.70 |
105.00 - 109.48 |
0.6703 times |
Fri 21 November 2025 |
106.46 (-2.79%) |
109.34 |
105.82 - 110.55 |
1.0929 times |
Fri 14 November 2025 |
109.52 (0.38%) |
109.26 |
107.86 - 112.11 |
0.8688 times |
Fri 07 November 2025 |
109.11 (3.53%) |
105.68 |
103.10 - 109.27 |
0.9474 times |
Fri 31 October 2025 |
105.39 (0%) |
105.09 |
102.95 - 105.77 |
0.3474 times |
Fri 31 October 2025 |
105.39 (-5.01%) |
110.82 |
102.95 - 112.24 |
1.4015 times |
Fri 24 October 2025 |
110.95 (3.77%) |
107.39 |
106.92 - 111.49 |
1.2276 times |
Fri 17 October 2025 |
106.92 (-0.16%) |
107.09 |
105.06 - 110.46 |
1.2556 times |
Fri 10 October 2025 |
107.09 (-2.63%) |
110.40 |
101.71 - 110.40 |
1.382 times |
Fri 03 October 2025 |
109.98 (-0.9%) |
110.92 |
105.83 - 111.65 |
1.4695 times |
Monthly price and charts TowersWatson Strong monthly Stock price targets for TowersWatson TW are 105.03 and 108.71 | Monthly Target 1 | 104.11 | | Monthly Target 2 | 105.94 | | Monthly Target 3 | 107.79 | | Monthly Target 4 | 109.62 | | Monthly Target 5 | 111.47 |
Monthly price and volumes Towers Watson
| Date |
Closing |
Open |
Range |
Volume |
Fri 05 December 2025 |
107.77 (-1%) |
108.21 |
105.96 - 109.64 |
0.1927 times |
Fri 28 November 2025 |
108.86 (3.29%) |
105.68 |
103.10 - 112.11 |
0.8552 times |
Fri 31 October 2025 |
105.39 (-5.04%) |
110.27 |
101.71 - 112.24 |
1.5969 times |
Tue 30 September 2025 |
110.98 (-10.04%) |
123.23 |
109.82 - 127.12 |
1.4393 times |
Fri 29 August 2025 |
123.36 (-10.96%) |
138.73 |
123.22 - 141.10 |
1.0015 times |
Thu 31 July 2025 |
138.55 (-5.36%) |
146.40 |
133.19 - 147.49 |
1.1657 times |
Mon 30 June 2025 |
146.40 (1.35%) |
143.57 |
134.40 - 146.51 |
0.9066 times |
Fri 30 May 2025 |
144.45 (4.45%) |
137.98 |
135.60 - 149.25 |
0.8181 times |
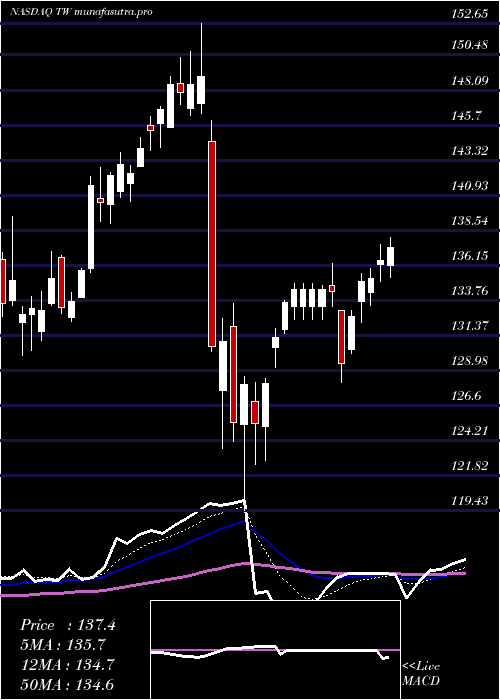
Wed 30 April 2025 |
138.30 (-6.84%) |
148.52 |
119.43 - 152.65 |
1.1984 times |
Mon 31 March 2025 |
148.46 (9.67%) |
136.38 |
130.03 - 148.98 |
0.8256 times |
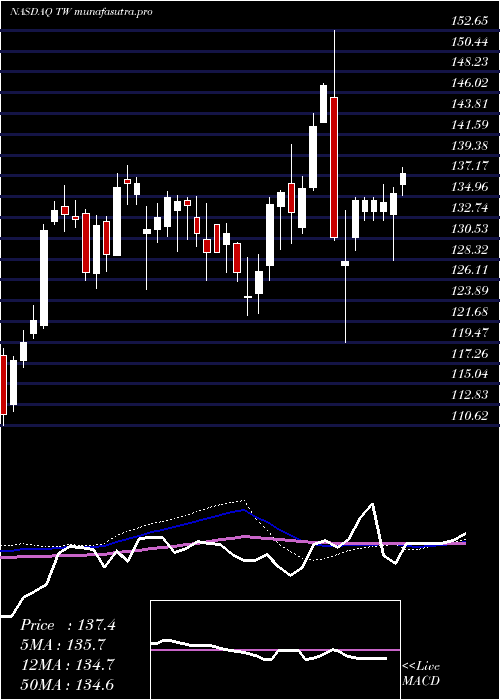
Fri 28 February 2025 |
135.37 (6.67%) |
124.21 |
122.31 - 135.67 |
0.9233 times |

DMA SMA EMA moving averages of Towers Watson TW
DMA (daily moving average) of Towers Watson TW
| DMA period | DMA value | | 5 day DMA | 107.36 | | 12 day DMA | 107.24 | | 20 day DMA | 108.23 | | 35 day DMA | 107.86 | | 50 day DMA | 107.94 | | 100 day DMA | 117.69 | | 150 day DMA | 125.48 | | 200 day DMA | 128.09 | EMA (exponential moving average) of Towers Watson TW
| EMA period | EMA current | EMA prev | EMA prev2 | | 5 day EMA | 107.64 | 107.57 | 107.4 | | 12 day EMA | 107.63 | 107.61 | 107.55 | | 20 day EMA | 107.73 | 107.73 | 107.71 | | 35 day EMA | 108.05 | 108.07 | 108.08 | | 50 day EMA | 108.17 | 108.19 | 108.2 |
SMA (simple moving average) of Towers Watson TW
| SMA period | SMA current | SMA prev | SMA prev2 | | 5 day SMA | 107.36 | 107.58 | 107.58 | | 12 day SMA | 107.24 | 107.39 | 107.54 | | 20 day SMA | 108.23 | 108.19 | 108.01 | | 35 day SMA | 107.86 | 107.82 | 107.82 | | 50 day SMA | 107.94 | 108 | 108.06 | | 100 day SMA | 117.69 | 117.97 | 118.23 | | 150 day SMA | 125.48 | 125.68 | 125.88 | | 200 day SMA | 128.09 | 128.2 | 128.3 |
|
|
