MammothEnergy TUSK full analysis,charts,indicators,moving averages,SMA,DMA,EMA,ADX,MACD,RSIMammoth Energy TUSK WideScreen charts, DMA,SMA,EMA technical analysis, forecast prediction, by indicators ADX,MACD,RSI,CCI NASDAQ stock exchange
operates under Energy sector & deals in Oilfield Services Equipment
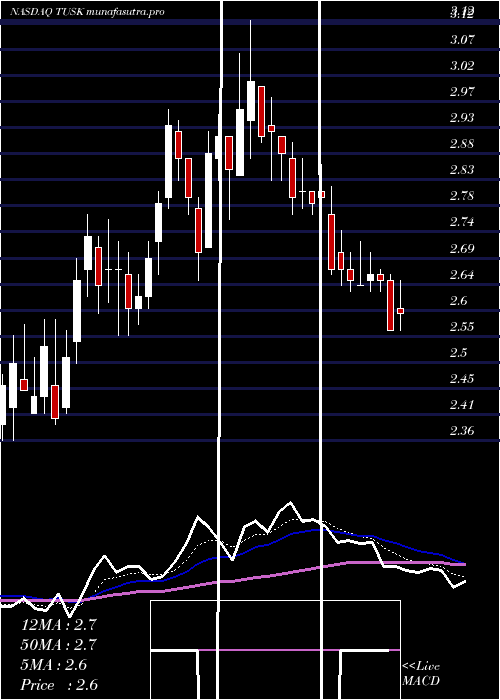
Daily price and charts and targets MammothEnergy Strong Daily Stock price targets for MammothEnergy TUSK are 1.89 and 2.1 | Daily Target 1 | 1.84 | | Daily Target 2 | 1.93 | | Daily Target 3 | 2.05 | | Daily Target 4 | 2.14 | | Daily Target 5 | 2.26 |
Daily price and volume Mammoth Energy
| Date |
Closing |
Open |
Range |
Volume |
Fri 05 December 2025 |
2.02 (-6.48%) |
2.17 |
1.96 - 2.17 |
1.2277 times |
Thu 04 December 2025 |
2.16 (0.47%) |
2.17 |
2.10 - 2.24 |
1.2241 times |
Wed 03 December 2025 |
2.15 (22.16%) |
1.94 |
1.92 - 2.20 |
4.3345 times |
Tue 02 December 2025 |
1.76 (-1.12%) |
1.77 |
1.76 - 1.80 |
0.8241 times |
Mon 01 December 2025 |
1.78 (-3.26%) |
1.82 |
1.77 - 1.84 |
0.4121 times |
Fri 28 November 2025 |
1.84 (2.22%) |
1.82 |
1.81 - 1.84 |
0.1321 times |
Wed 26 November 2025 |
1.80 (-2.7%) |
1.82 |
1.79 - 1.83 |
0.4457 times |
Tue 25 November 2025 |
1.85 (2.21%) |
1.82 |
1.77 - 1.85 |
0.4003 times |
Mon 24 November 2025 |
1.81 (1.69%) |
1.86 |
1.76 - 1.86 |
0.4657 times |
Fri 21 November 2025 |
1.78 (1.14%) |
1.74 |
1.72 - 1.79 |
0.5338 times |
Thu 20 November 2025 |
1.76 (-1.68%) |
1.80 |
1.73 - 1.87 |
0.5928 times |
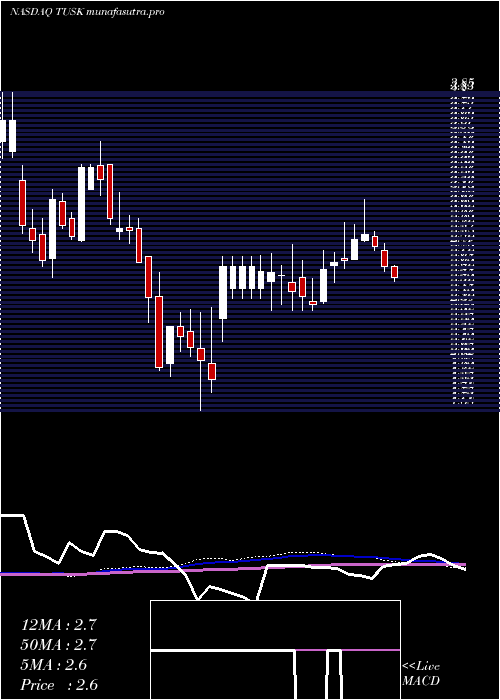
Weekly price and charts MammothEnergy Strong weekly Stock price targets for MammothEnergy TUSK are 1.89 and 2.37 | Weekly Target 1 | 1.53 | | Weekly Target 2 | 1.77 | | Weekly Target 3 | 2.0066666666667 | | Weekly Target 4 | 2.25 | | Weekly Target 5 | 2.49 |
Weekly price and volumes for Mammoth Energy
| Date |
Closing |
Open |
Range |
Volume |
Fri 05 December 2025 |
2.02 (9.78%) |
1.82 |
1.76 - 2.24 |
3.0015 times |
Fri 28 November 2025 |
1.84 (3.37%) |
1.86 |
1.76 - 1.86 |
0.5402 times |
Fri 21 November 2025 |
1.78 (-8.72%) |
1.97 |
1.72 - 1.97 |
1.1145 times |
Fri 14 November 2025 |
1.95 (-1.02%) |
2.00 |
1.88 - 2.08 |
1.0119 times |
Fri 07 November 2025 |
1.97 (-3.43%) |
2.10 |
1.96 - 2.14 |
0.8895 times |
Fri 31 October 2025 |
2.04 (0%) |
2.13 |
2.01 - 2.15 |
0.2759 times |
Fri 31 October 2025 |
2.04 (-5.12%) |
2.15 |
2.01 - 2.25 |
1.1709 times |
Fri 24 October 2025 |
2.15 (-3.15%) |
2.23 |
2.12 - 2.25 |
0.6376 times |
Fri 17 October 2025 |
2.22 (2.3%) |
2.22 |
2.15 - 2.31 |
0.467 times |
Fri 10 October 2025 |
2.17 (-5.65%) |
2.31 |
2.15 - 2.35 |
0.891 times |
Fri 03 October 2025 |
2.30 (-5.35%) |
2.43 |
2.23 - 2.43 |
1.2772 times |
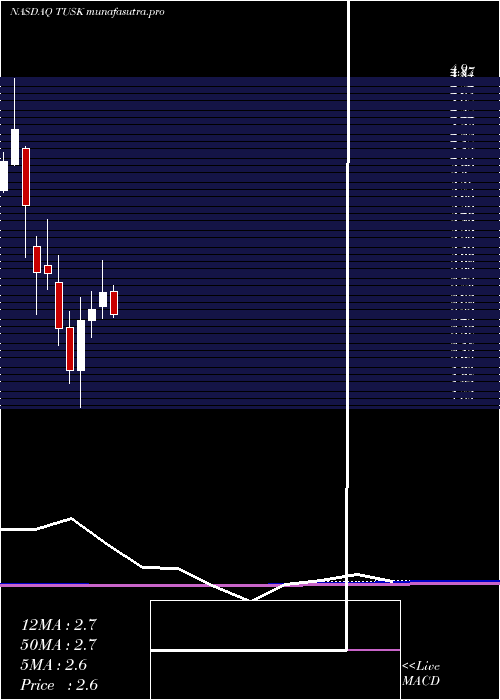
Monthly price and charts MammothEnergy Strong monthly Stock price targets for MammothEnergy TUSK are 1.89 and 2.37 | Monthly Target 1 | 1.53 | | Monthly Target 2 | 1.77 | | Monthly Target 3 | 2.0066666666667 | | Monthly Target 4 | 2.25 | | Monthly Target 5 | 2.49 |
Monthly price and volumes Mammoth Energy
| Date |
Closing |
Open |
Range |
Volume |
Fri 05 December 2025 |
2.02 (9.78%) |
1.82 |
1.76 - 2.24 |
0.6822 times |
Fri 28 November 2025 |
1.84 (-9.8%) |
2.10 |
1.72 - 2.14 |
0.8082 times |
Fri 31 October 2025 |
2.04 (-10.92%) |
2.30 |
2.01 - 2.35 |
0.9525 times |
Tue 30 September 2025 |
2.29 (-3.38%) |
2.36 |
2.26 - 2.54 |
0.8271 times |
Fri 29 August 2025 |
2.37 (-8.85%) |
2.58 |
2.11 - 2.59 |
0.8176 times |
Thu 31 July 2025 |
2.60 (-7.14%) |
2.81 |
2.50 - 2.87 |
0.6441 times |
Mon 30 June 2025 |
2.80 (6.06%) |
2.67 |
2.55 - 3.12 |
0.9429 times |
Fri 30 May 2025 |
2.64 (4.35%) |
2.53 |
2.36 - 2.81 |
1.0984 times |
Wed 30 April 2025 |
2.53 (24.02%) |
2.04 |
1.68 - 2.75 |
2.2569 times |
Mon 31 March 2025 |
2.04 (-16.73%) |
2.46 |
1.91 - 2.62 |
0.97 times |
Fri 28 February 2025 |
2.45 (-18.06%) |
2.90 |
2.28 - 3.17 |
0.505 times |
DMA SMA EMA moving averages of Mammoth Energy TUSK
DMA (daily moving average) of Mammoth Energy TUSK
| DMA period | DMA value | | 5 day DMA | 1.97 | | 12 day DMA | 1.88 | | 20 day DMA | 1.9 | | 35 day DMA | 1.99 | | 50 day DMA | 2.08 | | 100 day DMA | 2.25 | | 150 day DMA | 2.39 | | 200 day DMA | 2.37 | EMA (exponential moving average) of Mammoth Energy TUSK
| EMA period | EMA current | EMA prev | EMA prev2 | | 5 day EMA | 2 | 1.99 | 1.91 | | 12 day EMA | 1.94 | 1.93 | 1.89 | | 20 day EMA | 1.95 | 1.94 | 1.92 | | 35 day EMA | 2.02 | 2.02 | 2.01 | | 50 day EMA | 2.1 | 2.1 | 2.1 |
SMA (simple moving average) of Mammoth Energy TUSK
| SMA period | SMA current | SMA prev | SMA prev2 | | 5 day SMA | 1.97 | 1.94 | 1.87 | | 12 day SMA | 1.88 | 1.86 | 1.83 | | 20 day SMA | 1.9 | 1.9 | 1.9 | | 35 day SMA | 1.99 | 2 | 2 | | 50 day SMA | 2.08 | 2.09 | 2.1 | | 100 day SMA | 2.25 | 2.26 | 2.26 | | 150 day SMA | 2.39 | 2.39 | 2.4 | | 200 day SMA | 2.37 | 2.37 | 2.37 |
|
|
