TeslaInc TSLA full analysis,charts,indicators,moving averages,SMA,DMA,EMA,ADX,MACD,RSITesla Inc TSLA WideScreen charts, DMA,SMA,EMA technical analysis, forecast prediction, by indicators ADX,MACD,RSI,CCI NASDAQ stock exchange
operates under Capital Goods sector & deals in Auto Manufacturing
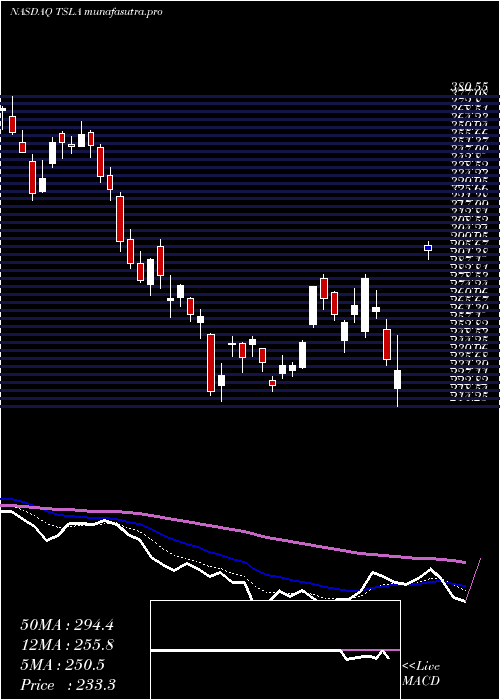
Daily price and charts and targets TeslaInc Strong Daily Stock price targets for TeslaInc TSLA are 449.97 and 459.21 | Daily Target 1 | 442.28 | | Daily Target 2 | 448.41 | | Daily Target 3 | 451.52 | | Daily Target 4 | 457.65 | | Daily Target 5 | 460.76 |
Daily price and volume Tesla Inc
| Date |
Closing |
Open |
Range |
Volume |
Thu 04 December 2025 |
454.54 (1.75%) |
448.89 |
445.39 - 454.63 |
0.8197 times |
Wed 03 December 2025 |
446.74 (4.13%) |
432.10 |
431.11 - 447.92 |
1.2688 times |
Tue 02 December 2025 |
429.01 (-0.26%) |
428.64 |
422.12 - 436.80 |
0.8153 times |
Mon 01 December 2025 |
430.14 (-0.01%) |
425.32 |
425.29 - 433.66 |
0.8326 times |
Fri 28 November 2025 |
430.17 (0.86%) |
426.59 |
426.20 - 432.93 |
0.5258 times |
Wed 26 November 2025 |
426.50 (1.71%) |
421.85 |
416.89 - 426.94 |
0.7513 times |
Tue 25 November 2025 |
419.31 (0.43%) |
415.22 |
405.95 - 420.48 |
0.853 times |
Mon 24 November 2025 |
417.52 (6.76%) |
398.74 |
396.00 - 421.72 |
1.0341 times |
Fri 21 November 2025 |
391.09 (-1.05%) |
402.32 |
383.76 - 402.80 |
1.4527 times |
Thu 20 November 2025 |
395.23 (-2.17%) |
414.63 |
394.74 - 428.94 |
1.6468 times |
Wed 19 November 2025 |
403.99 (0.68%) |
406.18 |
398.50 - 411.78 |
1.0449 times |
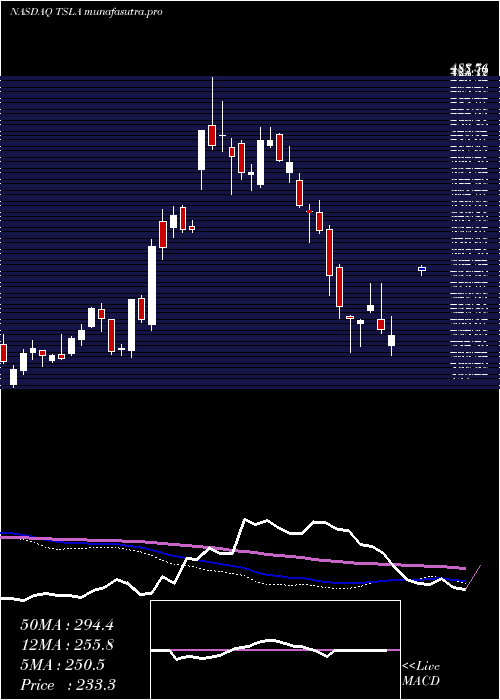
Weekly price and charts TeslaInc Strong weekly Stock price targets for TeslaInc TSLA are 438.33 and 470.84 | Weekly Target 1 | 411.25 | | Weekly Target 2 | 432.9 | | Weekly Target 3 | 443.76333333333 | | Weekly Target 4 | 465.41 | | Weekly Target 5 | 476.27 |
Weekly price and volumes for Tesla Inc
| Date |
Closing |
Open |
Range |
Volume |
Thu 04 December 2025 |
454.54 (5.67%) |
425.32 |
422.12 - 454.63 |
0.7992 times |
Fri 28 November 2025 |
430.17 (9.99%) |
398.74 |
396.00 - 432.93 |
0.6768 times |
Fri 21 November 2025 |
391.09 (-3.28%) |
398.74 |
383.76 - 428.94 |
1.4082 times |
Fri 14 November 2025 |
404.35 (-5.83%) |
439.60 |
382.78 - 449.67 |
1.1889 times |
Fri 07 November 2025 |
429.38 (-5.95%) |
454.46 |
421.88 - 467.45 |
1.0159 times |
Fri 31 October 2025 |
456.56 (0%) |
446.75 |
443.69 - 458.00 |
0.2579 times |
Fri 31 October 2025 |
456.56 (5.28%) |
439.98 |
438.69 - 467.00 |
1.2701 times |
Fri 24 October 2025 |
433.65 (-1.39%) |
443.20 |
413.90 - 451.68 |
1.0015 times |
Fri 17 October 2025 |
439.76 (6.35%) |
423.53 |
415.13 - 441.46 |
1.0867 times |
Fri 10 October 2025 |
413.49 (-3.84%) |
436.38 |
411.45 - 454.97 |
1.2948 times |
Fri 03 October 2025 |
430.00 (-2.36%) |
444.35 |
416.58 - 470.75 |
1.411 times |
Monthly price and charts TeslaInc Strong monthly Stock price targets for TeslaInc TSLA are 438.33 and 470.84 | Monthly Target 1 | 411.25 | | Monthly Target 2 | 432.9 | | Monthly Target 3 | 443.76333333333 | | Monthly Target 4 | 465.41 | | Monthly Target 5 | 476.27 |
Monthly price and volumes Tesla Inc
| Date |
Closing |
Open |
Range |
Volume |
Thu 04 December 2025 |
454.54 (5.67%) |
425.32 |
422.12 - 454.63 |
0.1364 times |
Fri 28 November 2025 |
430.17 (-5.78%) |
454.46 |
382.78 - 467.45 |
0.7323 times |
Fri 31 October 2025 |
456.56 (2.66%) |
443.80 |
411.45 - 470.75 |
0.9979 times |
Tue 30 September 2025 |
444.72 (33.2%) |
328.23 |
325.60 - 450.98 |
1.0436 times |
Fri 29 August 2025 |
333.87 (8.3%) |
306.20 |
297.82 - 355.39 |
0.8495 times |
Thu 31 July 2025 |
308.27 (-2.96%) |
298.46 |
288.77 - 338.00 |
1.1378 times |
Mon 30 June 2025 |
317.66 (-8.31%) |
343.50 |
273.21 - 357.54 |
1.244 times |
Fri 30 May 2025 |
346.46 (22.79%) |
280.01 |
271.00 - 367.71 |
1.163 times |
Wed 30 April 2025 |
282.16 (8.87%) |
263.80 |
214.25 - 294.86 |
1.4209 times |
Mon 31 March 2025 |
259.16 (-11.54%) |
300.34 |
217.02 - 303.94 |
1.2744 times |
Fri 28 February 2025 |
292.98 (-27.59%) |
386.68 |
273.60 - 394.00 |
0.838 times |
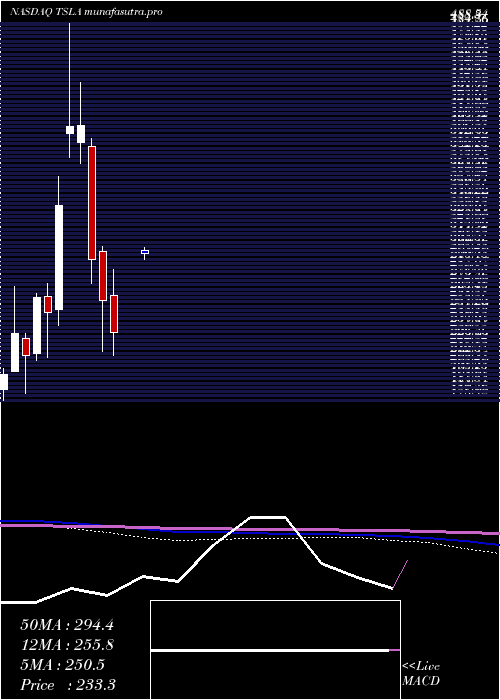
DMA SMA EMA moving averages of Tesla Inc TSLA
DMA (daily moving average) of Tesla Inc TSLA
| DMA period | DMA value | | 5 day DMA | 438.12 | | 12 day DMA | 420.46 | | 20 day DMA | 422.57 | | 35 day DMA | 433.19 | | 50 day DMA | 434.34 | | 100 day DMA | 391.17 | | 150 day DMA | 367.58 | | 200 day DMA | 341.87 | EMA (exponential moving average) of Tesla Inc TSLA
| EMA period | EMA current | EMA prev | EMA prev2 | | 5 day EMA | 439.89 | 432.57 | 425.48 | | 12 day EMA | 429.97 | 425.51 | 421.65 | | 20 day EMA | 428.56 | 425.83 | 423.63 | | 35 day EMA | 429.14 | 427.64 | 426.52 | | 50 day EMA | 434.4 | 433.58 | 433.04 |
SMA (simple moving average) of Tesla Inc TSLA
| SMA period | SMA current | SMA prev | SMA prev2 | | 5 day SMA | 438.12 | 432.51 | 427.03 | | 12 day SMA | 420.46 | 416.66 | 413.12 | | 20 day SMA | 422.57 | 422.96 | 422.83 | | 35 day SMA | 433.19 | 432.64 | 432.14 | | 50 day SMA | 434.34 | 434.11 | 433.69 | | 100 day SMA | 391.17 | 389.73 | 388.43 | | 150 day SMA | 367.58 | 366.43 | 365.4 | | 200 day SMA | 341.87 | 341.37 | 340.91 |
|
|
