TimberlandBancorp TSBK full analysis,charts,indicators,moving averages,SMA,DMA,EMA,ADX,MACD,RSITimberland Bancorp TSBK WideScreen charts, DMA,SMA,EMA technical analysis, forecast prediction, by indicators ADX,MACD,RSI,CCI NASDAQ stock exchange
operates under Finance sector & deals in Banks
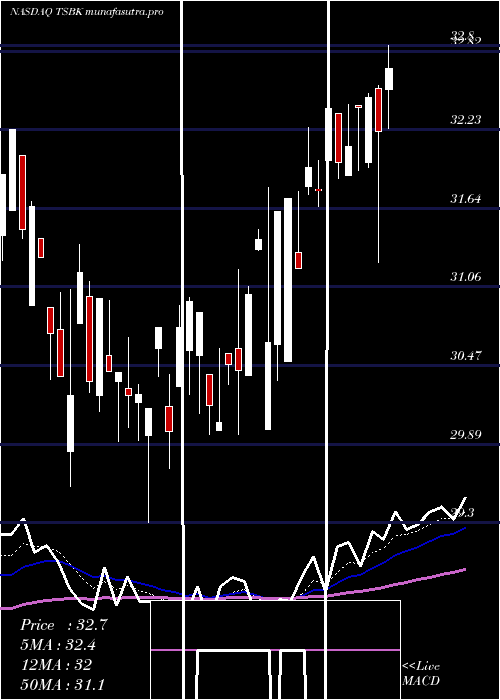
Daily price and charts and targets TimberlandBancorp Strong Daily Stock price targets for TimberlandBancorp TSBK are 30.75 and 31.55 | Daily Target 1 | 30.14 | | Daily Target 2 | 30.55 | | Daily Target 3 | 30.936666666667 | | Daily Target 4 | 31.35 | | Daily Target 5 | 31.74 |
Daily price and volume Timberland Bancorp
| Date |
Closing |
Open |
Range |
Volume |
Fri 01 August 2025 |
30.97 (-1.02%) |
30.58 |
30.52 - 31.32 |
0.9933 times |
Thu 31 July 2025 |
31.29 (-1.54%) |
31.46 |
31.14 - 31.64 |
1.2289 times |
Wed 30 July 2025 |
31.78 (-1.15%) |
32.30 |
31.66 - 32.34 |
0.6196 times |
Tue 29 July 2025 |
32.15 (-3.05%) |
33.30 |
32.15 - 33.50 |
1.1316 times |
Mon 28 July 2025 |
33.16 (0.73%) |
32.94 |
32.94 - 33.30 |
0.425 times |
Fri 25 July 2025 |
32.92 (-0.87%) |
33.09 |
32.80 - 33.35 |
0.4301 times |
Thu 24 July 2025 |
33.21 (-3.43%) |
32.62 |
32.62 - 33.99 |
1.0343 times |
Wed 23 July 2025 |
34.39 (6.47%) |
32.13 |
32.13 - 34.95 |
2.6882 times |
Tue 22 July 2025 |
32.30 (-0.09%) |
32.35 |
32.26 - 32.79 |
0.8705 times |
Mon 21 July 2025 |
32.33 (1%) |
32.08 |
31.93 - 32.76 |
0.5786 times |
Fri 18 July 2025 |
32.01 (-0.28%) |
32.38 |
31.80 - 32.50 |
0.9307 times |
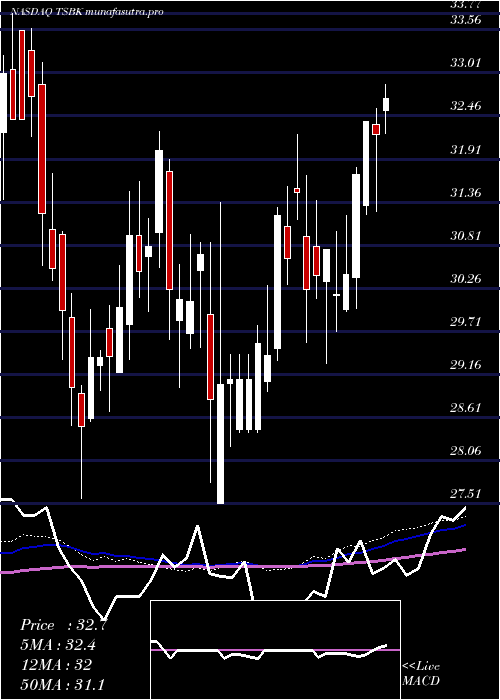
Weekly price and charts TimberlandBancorp Strong weekly Stock price targets for TimberlandBancorp TSBK are 29.26 and 32.24 | Weekly Target 1 | 28.68 | | Weekly Target 2 | 29.83 | | Weekly Target 3 | 31.663333333333 | | Weekly Target 4 | 32.81 | | Weekly Target 5 | 34.64 |
Weekly price and volumes for Timberland Bancorp
| Date |
Closing |
Open |
Range |
Volume |
Fri 01 August 2025 |
30.97 (-5.92%) |
32.94 |
30.52 - 33.50 |
1.3931 times |
Fri 25 July 2025 |
32.92 (2.84%) |
32.08 |
31.93 - 34.95 |
1.7742 times |
Fri 18 July 2025 |
32.01 (-0.65%) |
32.53 |
31.50 - 32.86 |
1.1047 times |
Fri 11 July 2025 |
32.22 (-0.52%) |
32.35 |
31.24 - 32.56 |
0.9439 times |
Thu 03 July 2025 |
32.39 (2.11%) |
31.32 |
31.20 - 32.39 |
0.7103 times |
Fri 27 June 2025 |
31.72 (4.2%) |
30.40 |
30.00 - 31.80 |
1.1677 times |
Fri 20 June 2025 |
30.44 (0.86%) |
29.99 |
29.96 - 31.19 |
0.5027 times |
Fri 13 June 2025 |
30.18 (-1.89%) |
30.17 |
29.71 - 30.98 |
1.0639 times |
Fri 06 June 2025 |
30.76 (1.08%) |
30.35 |
29.30 - 30.76 |
0.8466 times |
Fri 30 May 2025 |
30.43 (0.6%) |
30.79 |
30.13 - 31.38 |
0.493 times |
Fri 23 May 2025 |
30.25 (-3.94%) |
30.92 |
29.57 - 31.70 |
0.5368 times |
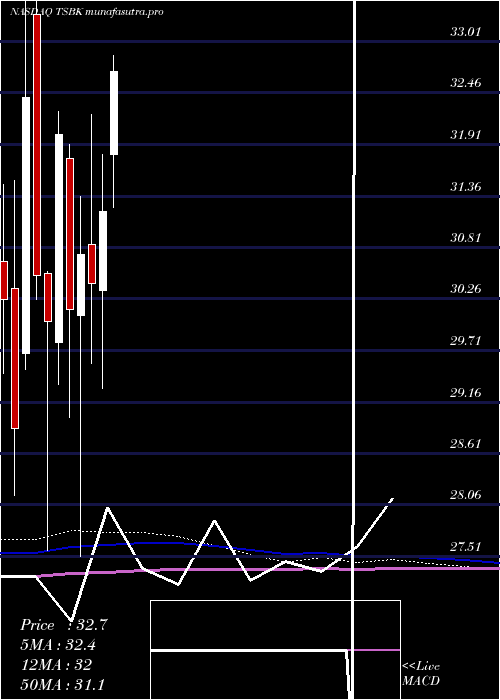
Monthly price and charts TimberlandBancorp Strong monthly Stock price targets for TimberlandBancorp TSBK are 30.75 and 31.55 | Monthly Target 1 | 30.14 | | Monthly Target 2 | 30.55 | | Monthly Target 3 | 30.936666666667 | | Monthly Target 4 | 31.35 | | Monthly Target 5 | 31.74 |
Monthly price and volumes Timberland Bancorp
| Date |
Closing |
Open |
Range |
Volume |
Fri 01 August 2025 |
30.97 (-1.02%) |
30.58 |
30.52 - 31.32 |
0.0882 times |
Thu 31 July 2025 |
31.29 (0.29%) |
31.81 |
31.14 - 34.95 |
1.531 times |
Mon 30 June 2025 |
31.20 (2.53%) |
30.35 |
29.30 - 31.80 |
1.0454 times |
Fri 30 May 2025 |
30.43 (-1.01%) |
30.84 |
29.57 - 32.23 |
0.7491 times |
Wed 30 April 2025 |
30.74 (1.96%) |
30.08 |
27.51 - 31.36 |
1.1503 times |
Mon 31 March 2025 |
30.15 (-5.84%) |
31.76 |
28.99 - 31.91 |
1.3049 times |
Fri 28 February 2025 |
32.02 (6.66%) |
29.80 |
29.35 - 32.27 |
0.9227 times |
Fri 31 January 2025 |
30.02 (-1.61%) |
30.54 |
27.57 - 30.55 |
0.938 times |
Tue 31 December 2024 |
30.51 (-5.89%) |
33.30 |
30.26 - 33.58 |
1.015 times |
Tue 26 November 2024 |
32.42 (12.26%) |
29.68 |
29.51 - 33.98 |
1.2554 times |
Thu 31 October 2024 |
28.88 (-4.56%) |
30.38 |
28.16 - 31.53 |
0.7645 times |
DMA SMA EMA moving averages of Timberland Bancorp TSBK
DMA (daily moving average) of Timberland Bancorp TSBK
| DMA period | DMA value | | 5 day DMA | 31.87 | | 12 day DMA | 32.38 | | 20 day DMA | 32.34 | | 35 day DMA | 31.81 | | 50 day DMA | 31.43 | | 100 day DMA | 30.76 | | 150 day DMA | 30.56 | | 200 day DMA | 30.75 | EMA (exponential moving average) of Timberland Bancorp TSBK
| EMA period | EMA current | EMA prev | EMA prev2 | | 5 day EMA | 31.69 | 32.05 | 32.43 | | 12 day EMA | 32.1 | 32.31 | 32.49 | | 20 day EMA | 32.11 | 32.23 | 32.33 | | 35 day EMA | 31.88 | 31.93 | 31.97 | | 50 day EMA | 31.5 | 31.52 | 31.53 |
SMA (simple moving average) of Timberland Bancorp TSBK
| SMA period | SMA current | SMA prev | SMA prev2 | | 5 day SMA | 31.87 | 32.26 | 32.64 | | 12 day SMA | 32.38 | 32.5 | 32.55 | | 20 day SMA | 32.34 | 32.41 | 32.43 | | 35 day SMA | 31.81 | 31.81 | 31.77 | | 50 day SMA | 31.43 | 31.45 | 31.45 | | 100 day SMA | 30.76 | 30.75 | 30.74 | | 150 day SMA | 30.56 | 30.56 | 30.56 | | 200 day SMA | 30.75 | 30.74 | 30.72 |
|
|
