TranscatInc TRNS full analysis,charts,indicators,moving averages,SMA,DMA,EMA,ADX,MACD,RSITranscat Inc TRNS WideScreen charts, DMA,SMA,EMA technical analysis, forecast prediction, by indicators ADX,MACD,RSI,CCI NASDAQ stock exchange
operates under Capital Goods sector & deals in Electrical Products
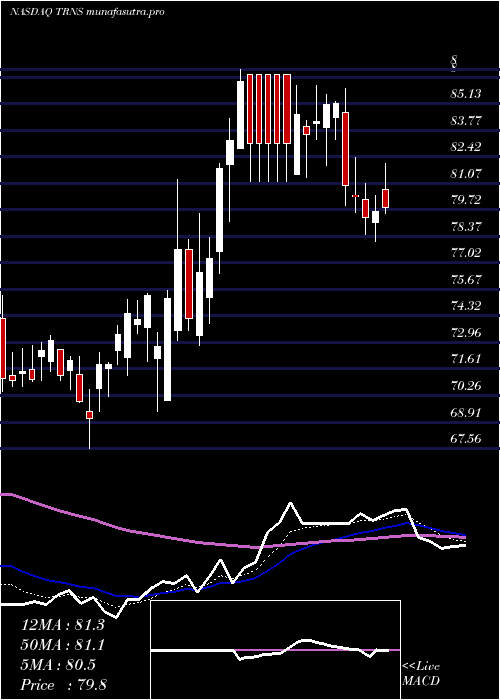
Daily price and charts and targets TranscatInc Strong Daily Stock price targets for TranscatInc TRNS are 85.19 and 86.92 | Daily Target 1 | 84.72 | | Daily Target 2 | 85.65 | | Daily Target 3 | 86.446666666667 | | Daily Target 4 | 87.38 | | Daily Target 5 | 88.18 |
Daily price and volume Transcat Inc
| Date |
Closing |
Open |
Range |
Volume |
Fri 11 July 2025 |
86.59 (-0.92%) |
86.65 |
85.51 - 87.24 |
0.677 times |
Thu 10 July 2025 |
87.39 (1.66%) |
86.51 |
86.50 - 89.86 |
1.1186 times |
Wed 09 July 2025 |
85.96 (-2.07%) |
87.66 |
83.41 - 89.05 |
0.9427 times |
Tue 08 July 2025 |
87.78 (1.66%) |
86.87 |
84.67 - 88.73 |
0.6717 times |
Mon 07 July 2025 |
86.35 (-3.93%) |
89.88 |
86.09 - 89.88 |
0.6655 times |
Thu 03 July 2025 |
89.88 (1.16%) |
88.79 |
87.04 - 90.79 |
0.3705 times |
Wed 02 July 2025 |
88.85 (2.04%) |
86.45 |
86.45 - 89.34 |
1.1328 times |
Tue 01 July 2025 |
87.07 (1.29%) |
85.53 |
84.75 - 88.12 |
0.741 times |
Mon 30 June 2025 |
85.96 (1.34%) |
85.15 |
82.16 - 88.32 |
1.0555 times |
Fri 27 June 2025 |
84.82 (-0.61%) |
85.78 |
83.57 - 87.05 |
2.6246 times |
Thu 26 June 2025 |
85.34 (4.42%) |
81.73 |
81.73 - 85.95 |
1.2208 times |
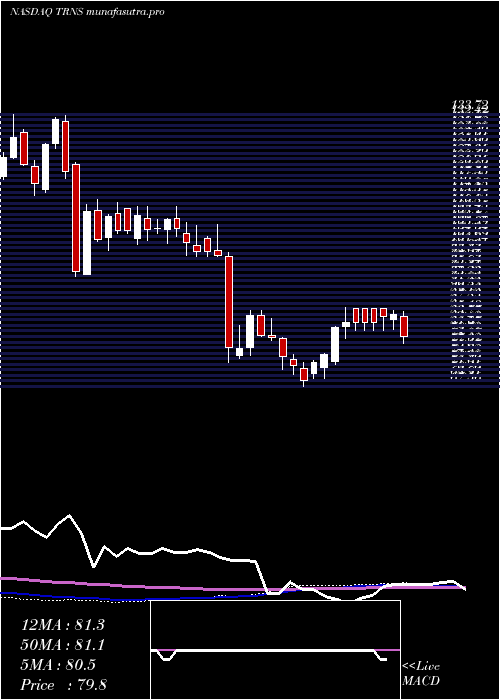
Weekly price and charts TranscatInc Strong weekly Stock price targets for TranscatInc TRNS are 81.77 and 88.24 | Weekly Target 1 | 80.16 | | Weekly Target 2 | 83.37 | | Weekly Target 3 | 86.626666666667 | | Weekly Target 4 | 89.84 | | Weekly Target 5 | 93.1 |
Weekly price and volumes for Transcat Inc
| Date |
Closing |
Open |
Range |
Volume |
Fri 11 July 2025 |
86.59 (-3.66%) |
89.88 |
83.41 - 89.88 |
0.7627 times |
Thu 03 July 2025 |
89.88 (5.97%) |
85.15 |
82.16 - 90.79 |
0.6176 times |
Fri 27 June 2025 |
84.82 (5.31%) |
79.99 |
79.12 - 87.05 |
1.145 times |
Fri 20 June 2025 |
80.54 (1.74%) |
80.53 |
79.28 - 83.38 |
0.5531 times |
Fri 13 June 2025 |
79.16 (1.51%) |
78.30 |
74.47 - 79.76 |
1.3065 times |
Fri 06 June 2025 |
77.98 (-10.76%) |
87.97 |
77.36 - 90.06 |
1.0995 times |
Fri 30 May 2025 |
87.38 (-4.31%) |
91.94 |
86.78 - 93.77 |
0.5684 times |
Fri 23 May 2025 |
91.32 (12.39%) |
80.52 |
79.32 - 97.08 |
2.09 times |
Fri 16 May 2025 |
81.25 (3.21%) |
82.12 |
78.44 - 83.51 |
1.1813 times |
Fri 09 May 2025 |
78.72 (-1.38%) |
79.95 |
76.15 - 81.92 |
0.6759 times |
Fri 02 May 2025 |
79.82 (-6.24%) |
84.67 |
78.13 - 85.88 |
0.8198 times |
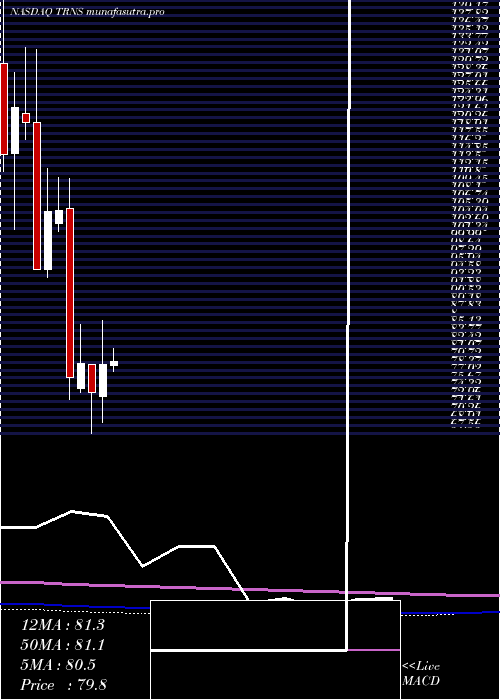
Monthly price and charts TranscatInc Strong monthly Stock price targets for TranscatInc TRNS are 85 and 92.38 | Monthly Target 1 | 79.55 | | Monthly Target 2 | 83.07 | | Monthly Target 3 | 86.93 | | Monthly Target 4 | 90.45 | | Monthly Target 5 | 94.31 |
Monthly price and volumes Transcat Inc
| Date |
Closing |
Open |
Range |
Volume |
Fri 11 July 2025 |
86.59 (0.73%) |
85.53 |
83.41 - 90.79 |
0.378 times |
Mon 30 June 2025 |
85.96 (-1.63%) |
87.97 |
74.47 - 90.06 |
1.3747 times |
Fri 30 May 2025 |
87.38 (10.15%) |
79.07 |
76.15 - 97.08 |
1.5214 times |
Wed 30 April 2025 |
79.33 (6.55%) |
73.90 |
69.43 - 86.89 |
1.2617 times |
Mon 31 March 2025 |
74.45 (-6.38%) |
79.24 |
67.56 - 79.36 |
0.7326 times |
Fri 28 February 2025 |
79.52 (3.25%) |
75.20 |
74.47 - 86.13 |
0.9726 times |
Fri 31 January 2025 |
77.02 (-27.16%) |
106.14 |
73.37 - 111.29 |
1.4791 times |
Tue 31 December 2024 |
105.74 (0.11%) |
103.47 |
102.08 - 111.44 |
0.4214 times |
Tue 26 November 2024 |
105.62 (10.52%) |
95.67 |
94.29 - 112.94 |
0.8975 times |
Thu 31 October 2024 |
95.57 (-20.87%) |
120.76 |
95.54 - 133.40 |
0.961 times |
Mon 30 September 2024 |
120.77 (-2.18%) |
122.32 |
117.91 - 133.72 |
0.7624 times |
DMA SMA EMA moving averages of Transcat Inc TRNS
DMA (daily moving average) of Transcat Inc TRNS
| DMA period | DMA value | | 5 day DMA | 86.81 | | 12 day DMA | 86.48 | | 20 day DMA | 83.75 | | 35 day DMA | 84.6 | | 50 day DMA | 83.21 | | 100 day DMA | 80.5 | | 150 day DMA | 86.34 | | 200 day DMA | 93.84 | EMA (exponential moving average) of Transcat Inc TRNS
| EMA period | EMA current | EMA prev | EMA prev2 | | 5 day EMA | 86.9 | 87.06 | 86.9 | | 12 day EMA | 86.06 | 85.96 | 85.7 | | 20 day EMA | 85.12 | 84.97 | 84.71 | | 35 day EMA | 84.24 | 84.1 | 83.91 | | 50 day EMA | 83.62 | 83.5 | 83.34 |
SMA (simple moving average) of Transcat Inc TRNS
| SMA period | SMA current | SMA prev | SMA prev2 | | 5 day SMA | 86.81 | 87.47 | 87.76 | | 12 day SMA | 86.48 | 86.19 | 85.6 | | 20 day SMA | 83.75 | 83.17 | 82.63 | | 35 day SMA | 84.6 | 84.45 | 84.27 | | 50 day SMA | 83.21 | 83.1 | 83.05 | | 100 day SMA | 80.5 | 80.49 | 80.45 | | 150 day SMA | 86.34 | 86.51 | 86.66 | | 200 day SMA | 93.84 | 94.04 | 94.22 |
|
|
