LendingtreeInc TREE full analysis,charts,indicators,moving averages,SMA,DMA,EMA,ADX,MACD,RSILendingtree Inc TREE WideScreen charts, DMA,SMA,EMA technical analysis, forecast prediction, by indicators ADX,MACD,RSI,CCI NASDAQ stock exchange
operates under Finance sector & deals in Finance Consumer Services
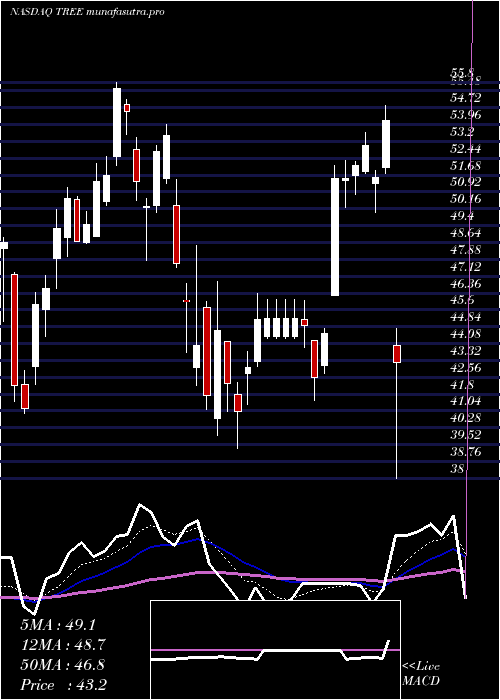
Daily price and charts and targets LendingtreeInc Strong Daily Stock price targets for LendingtreeInc TREE are 37.45 and 39.6 | Daily Target 1 | 37.07 | | Daily Target 2 | 37.83 | | Daily Target 3 | 39.216666666667 | | Daily Target 4 | 39.98 | | Daily Target 5 | 41.37 |
Daily price and volume Lendingtree Inc
| Date |
Closing |
Open |
Range |
Volume |
Fri 11 July 2025 |
38.60 (-5.21%) |
40.31 |
38.45 - 40.60 |
1.0331 times |
Thu 10 July 2025 |
40.72 (4.28%) |
39.17 |
38.84 - 41.25 |
2.1671 times |
Wed 09 July 2025 |
39.05 (1.77%) |
38.77 |
38.51 - 39.33 |
0.9473 times |
Tue 08 July 2025 |
38.37 (0.31%) |
38.71 |
38.34 - 39.10 |
0.6139 times |
Mon 07 July 2025 |
38.25 (-1.32%) |
38.22 |
37.83 - 39.15 |
0.8226 times |
Thu 03 July 2025 |
38.76 (0.03%) |
39.18 |
38.28 - 39.25 |
0.4243 times |
Wed 02 July 2025 |
38.75 (1.1%) |
38.50 |
38.08 - 38.98 |
0.7669 times |
Tue 01 July 2025 |
38.33 (3.4%) |
36.94 |
36.38 - 38.63 |
0.8431 times |
Mon 30 June 2025 |
37.07 (0.32%) |
37.37 |
36.74 - 37.78 |
0.9895 times |
Fri 27 June 2025 |
36.95 (1.85%) |
36.71 |
36.00 - 37.37 |
1.3922 times |
Thu 26 June 2025 |
36.28 (1.4%) |
35.83 |
35.36 - 36.41 |
0.7768 times |
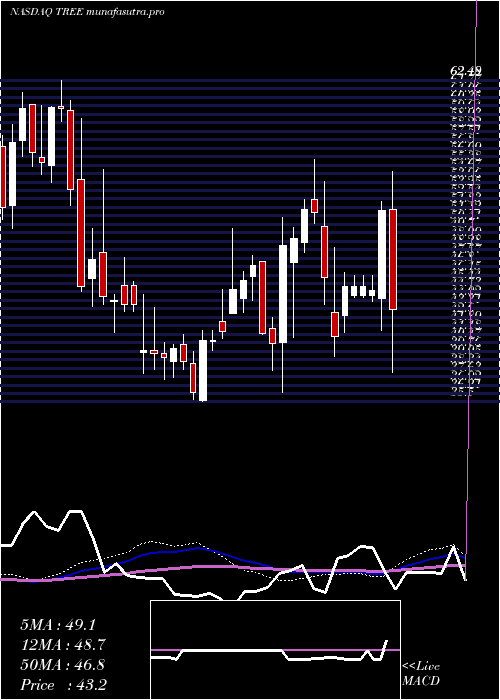
Weekly price and charts LendingtreeInc Strong weekly Stock price targets for LendingtreeInc TREE are 38.22 and 41.64 | Weekly Target 1 | 35.81 | | Weekly Target 2 | 37.2 | | Weekly Target 3 | 39.226666666667 | | Weekly Target 4 | 40.62 | | Weekly Target 5 | 42.65 |
Weekly price and volumes for Lendingtree Inc
| Date |
Closing |
Open |
Range |
Volume |
Fri 11 July 2025 |
38.60 (-0.41%) |
38.22 |
37.83 - 41.25 |
1.0179 times |
Thu 03 July 2025 |
38.76 (4.9%) |
37.37 |
36.38 - 39.25 |
0.5512 times |
Fri 27 June 2025 |
36.95 (5.97%) |
34.47 |
33.88 - 37.37 |
0.8193 times |
Fri 20 June 2025 |
34.87 (2.08%) |
34.69 |
33.50 - 35.62 |
0.4836 times |
Fri 13 June 2025 |
34.16 (-5.08%) |
36.52 |
34.00 - 37.64 |
0.8247 times |
Fri 06 June 2025 |
35.99 (2.77%) |
34.83 |
33.82 - 36.30 |
0.9504 times |
Fri 30 May 2025 |
35.02 (-0.4%) |
35.75 |
34.67 - 36.39 |
0.9625 times |
Fri 23 May 2025 |
35.16 (-7.98%) |
37.51 |
34.01 - 38.50 |
0.8901 times |
Fri 16 May 2025 |
38.21 (-1.27%) |
40.57 |
37.50 - 41.46 |
1.2426 times |
Fri 09 May 2025 |
38.70 (-10.46%) |
42.52 |
36.71 - 44.31 |
2.2578 times |
Fri 02 May 2025 |
43.22 (-16.14%) |
51.68 |
38.00 - 54.81 |
3.088 times |
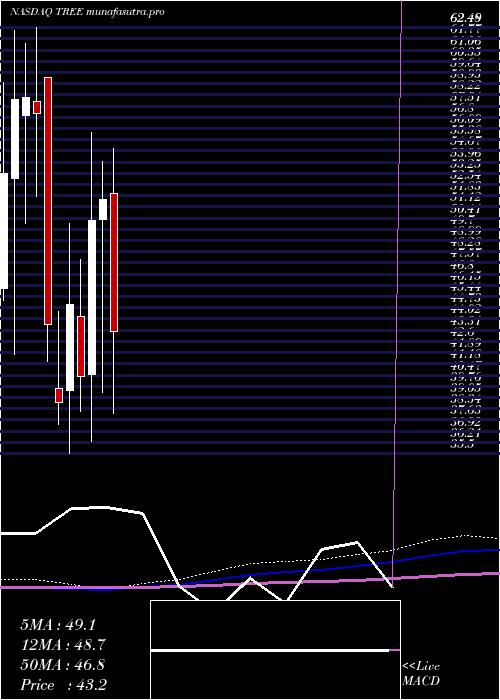
Monthly price and charts LendingtreeInc Strong monthly Stock price targets for LendingtreeInc TREE are 37.49 and 42.36 | Monthly Target 1 | 33.87 | | Monthly Target 2 | 36.24 | | Monthly Target 3 | 38.743333333333 | | Monthly Target 4 | 41.11 | | Monthly Target 5 | 43.61 |
Monthly price and volumes Lendingtree Inc
| Date |
Closing |
Open |
Range |
Volume |
Fri 11 July 2025 |
38.60 (4.13%) |
36.94 |
36.38 - 41.25 |
0.3757 times |
Mon 30 June 2025 |
37.07 (5.85%) |
34.83 |
33.50 - 37.78 |
0.8815 times |
Fri 30 May 2025 |
35.02 (-32.12%) |
52.00 |
34.01 - 54.81 |
2.1406 times |
Wed 30 April 2025 |
51.59 (2.63%) |
50.31 |
39.33 - 53.97 |
0.9709 times |
Mon 31 March 2025 |
50.27 (24.46%) |
40.49 |
36.29 - 55.86 |
1.2204 times |
Fri 28 February 2025 |
40.39 (-10.1%) |
44.15 |
38.13 - 47.79 |
0.5278 times |
Fri 31 January 2025 |
44.93 (15.95%) |
39.48 |
35.50 - 50.09 |
1.0367 times |
Tue 31 December 2024 |
38.75 (-11.33%) |
39.62 |
37.35 - 44.51 |
0.7131 times |
Tue 26 November 2024 |
43.70 (-23.37%) |
59.31 |
41.35 - 59.31 |
1.4732 times |
Thu 31 October 2024 |
57.03 (-1.72%) |
57.79 |
51.76 - 62.49 |
0.6601 times |
Mon 30 September 2024 |
58.03 (0.17%) |
56.94 |
50.10 - 61.50 |
0.5692 times |
DMA SMA EMA moving averages of Lendingtree Inc TREE
DMA (daily moving average) of Lendingtree Inc TREE
| DMA period | DMA value | | 5 day DMA | 39 | | 12 day DMA | 38.08 | | 20 day DMA | 36.91 | | 35 day DMA | 36.36 | | 50 day DMA | 37.97 | | 100 day DMA | 41.95 | | 150 day DMA | 41.89 | | 200 day DMA | 44.86 | EMA (exponential moving average) of Lendingtree Inc TREE
| EMA period | EMA current | EMA prev | EMA prev2 | | 5 day EMA | 39.02 | 39.23 | 38.48 | | 12 day EMA | 38.2 | 38.13 | 37.66 | | 20 day EMA | 37.76 | 37.67 | 37.35 | | 35 day EMA | 38.28 | 38.26 | 38.12 | | 50 day EMA | 38.93 | 38.94 | 38.87 |
SMA (simple moving average) of Lendingtree Inc TREE
| SMA period | SMA current | SMA prev | SMA prev2 | | 5 day SMA | 39 | 39.03 | 38.64 | | 12 day SMA | 38.08 | 37.91 | 37.48 | | 20 day SMA | 36.91 | 36.8 | 36.57 | | 35 day SMA | 36.36 | 36.35 | 36.27 | | 50 day SMA | 37.97 | 38.24 | 38.46 | | 100 day SMA | 41.95 | 42.02 | 42.06 | | 150 day SMA | 41.89 | 41.92 | 41.94 | | 200 day SMA | 44.86 | 44.96 | 45.02 |
|
|
