TandyLeather TLF full analysis,charts,indicators,moving averages,SMA,DMA,EMA,ADX,MACD,RSITandy Leather TLF WideScreen charts, DMA,SMA,EMA technical analysis, forecast prediction, by indicators ADX,MACD,RSI,CCI NASDAQ stock exchange
operates under Consumer Non Durables sector & deals in Apparel
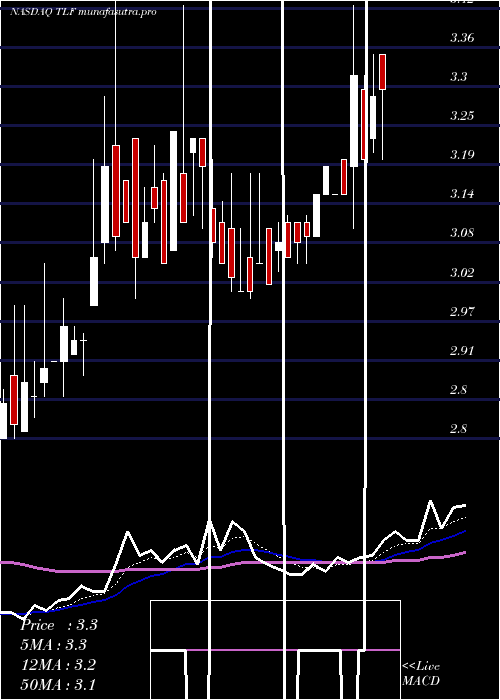
Daily price and charts and targets TandyLeather Strong Daily Stock price targets for TandyLeather TLF are 3.49 and 3.6 | Daily Target 1 | 3.4 | | Daily Target 2 | 3.46 | | Daily Target 3 | 3.51 | | Daily Target 4 | 3.57 | | Daily Target 5 | 3.62 |
Daily price and volume Tandy Leather
| Date |
Closing |
Open |
Range |
Volume |
Fri 01 August 2025 |
3.52 (0.86%) |
3.46 |
3.45 - 3.56 |
0.8128 times |
Thu 31 July 2025 |
3.49 (1.16%) |
3.45 |
3.45 - 3.60 |
0.7075 times |
Wed 30 July 2025 |
3.45 (-2.82%) |
3.47 |
3.41 - 3.55 |
0.7928 times |
Tue 29 July 2025 |
3.55 (-0.84%) |
3.59 |
3.40 - 3.64 |
0.848 times |
Mon 28 July 2025 |
3.58 (3.47%) |
3.51 |
3.48 - 3.78 |
2.2228 times |
Fri 25 July 2025 |
3.46 (-0.29%) |
3.51 |
3.45 - 3.51 |
0.3462 times |
Thu 24 July 2025 |
3.47 (0.87%) |
3.48 |
3.45 - 3.49 |
0.296 times |
Wed 23 July 2025 |
3.44 (0%) |
3.48 |
3.37 - 3.59 |
1.992 times |
Tue 22 July 2025 |
3.44 (2.38%) |
3.31 |
3.29 - 3.47 |
1.2193 times |
Mon 21 July 2025 |
3.36 (1.82%) |
3.39 |
3.31 - 3.40 |
0.7627 times |
Fri 18 July 2025 |
3.30 (-0.6%) |
3.31 |
3.26 - 3.39 |
0.3478 times |
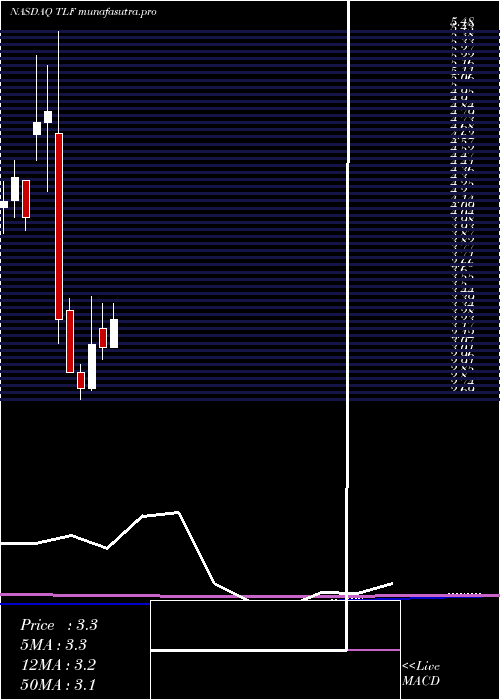
Weekly price and charts TandyLeather Strong weekly Stock price targets for TandyLeather TLF are 3.46 and 3.84 | Weekly Target 1 | 3.19 | | Weekly Target 2 | 3.35 | | Weekly Target 3 | 3.5666666666667 | | Weekly Target 4 | 3.73 | | Weekly Target 5 | 3.95 |
Weekly price and volumes for Tandy Leather
| Date |
Closing |
Open |
Range |
Volume |
Fri 01 August 2025 |
3.52 (1.73%) |
3.51 |
3.40 - 3.78 |
1.4107 times |
Fri 25 July 2025 |
3.46 (4.85%) |
3.39 |
3.29 - 3.59 |
1.2096 times |
Fri 18 July 2025 |
3.30 (0%) |
3.34 |
3.21 - 3.39 |
0.7191 times |
Fri 11 July 2025 |
3.30 (4.76%) |
3.20 |
3.10 - 3.42 |
1.1636 times |
Thu 03 July 2025 |
3.15 (2.27%) |
3.11 |
3.05 - 3.19 |
0.3287 times |
Fri 27 June 2025 |
3.08 (2.33%) |
3.05 |
3.02 - 3.18 |
0.5956 times |
Fri 20 June 2025 |
3.01 (-1.31%) |
3.10 |
3.00 - 3.18 |
0.3063 times |
Fri 13 June 2025 |
3.05 (-5.86%) |
3.18 |
3.05 - 3.42 |
1.0176 times |
Fri 06 June 2025 |
3.24 (4.18%) |
3.23 |
3.00 - 3.24 |
0.7218 times |
Fri 30 May 2025 |
3.11 (5.78%) |
2.99 |
2.99 - 3.47 |
2.527 times |
Fri 23 May 2025 |
2.94 (2.8%) |
2.88 |
2.86 - 3.05 |
2.197 times |
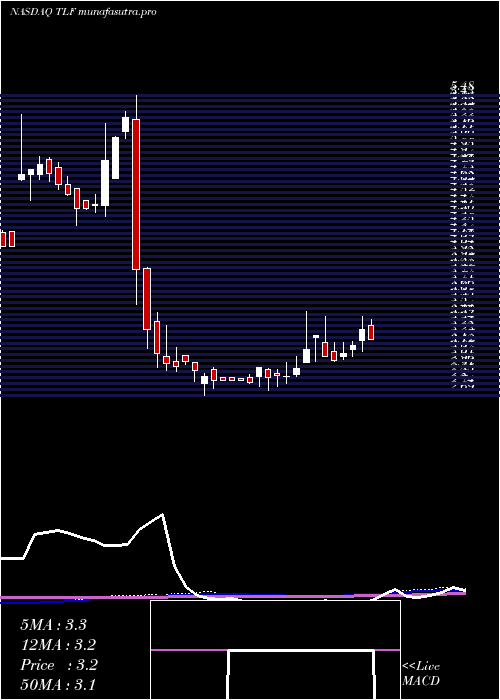
Monthly price and charts TandyLeather Strong monthly Stock price targets for TandyLeather TLF are 3.49 and 3.6 | Monthly Target 1 | 3.4 | | Monthly Target 2 | 3.46 | | Monthly Target 3 | 3.51 | | Monthly Target 4 | 3.57 | | Monthly Target 5 | 3.62 |
Monthly price and volumes Tandy Leather
| Date |
Closing |
Open |
Range |
Volume |
Fri 01 August 2025 |
3.52 (0.86%) |
3.46 |
3.45 - 3.56 |
0.0385 times |
Thu 31 July 2025 |
3.49 (12.94%) |
3.09 |
3.09 - 3.78 |
0.8108 times |
Mon 30 June 2025 |
3.09 (-0.64%) |
3.23 |
3.00 - 3.42 |
0.5026 times |
Fri 30 May 2025 |
3.11 (11.87%) |
2.78 |
2.76 - 3.47 |
1.2273 times |
Wed 30 April 2025 |
2.78 (-4.14%) |
2.90 |
2.69 - 2.96 |
0.7908 times |
Mon 31 March 2025 |
2.90 (-12.12%) |
3.37 |
2.90 - 3.46 |
0.7819 times |
Fri 28 February 2025 |
3.30 (-32.24%) |
4.71 |
3.12 - 5.48 |
2.9897 times |
Fri 31 January 2025 |
4.87 (1.67%) |
4.79 |
4.27 - 5.22 |
1.7122 times |
Tue 31 December 2024 |
4.79 (17.69%) |
4.70 |
4.50 - 5.30 |
0.7755 times |
Tue 26 November 2024 |
4.07 (-6.86%) |
4.35 |
3.97 - 4.35 |
0.3708 times |
Thu 31 October 2024 |
4.37 (4.3%) |
4.20 |
4.07 - 4.50 |
0.411 times |
DMA SMA EMA moving averages of Tandy Leather TLF
DMA (daily moving average) of Tandy Leather TLF
| DMA period | DMA value | | 5 day DMA | 3.52 | | 12 day DMA | 3.45 | | 20 day DMA | 3.37 | | 35 day DMA | 3.25 | | 50 day DMA | 3.2 | | 100 day DMA | 3.04 | | 150 day DMA | 3.48 | | 200 day DMA | 3.71 | EMA (exponential moving average) of Tandy Leather TLF
| EMA period | EMA current | EMA prev | EMA prev2 | | 5 day EMA | 3.49 | 3.48 | 3.48 | | 12 day EMA | 3.44 | 3.43 | 3.42 | | 20 day EMA | 3.38 | 3.37 | 3.36 | | 35 day EMA | 3.29 | 3.28 | 3.27 | | 50 day EMA | 3.2 | 3.19 | 3.18 |
SMA (simple moving average) of Tandy Leather TLF
| SMA period | SMA current | SMA prev | SMA prev2 | | 5 day SMA | 3.52 | 3.51 | 3.5 | | 12 day SMA | 3.45 | 3.42 | 3.41 | | 20 day SMA | 3.37 | 3.36 | 3.34 | | 35 day SMA | 3.25 | 3.24 | 3.23 | | 50 day SMA | 3.2 | 3.18 | 3.17 | | 100 day SMA | 3.04 | 3.03 | 3.03 | | 150 day SMA | 3.48 | 3.49 | 3.5 | | 200 day SMA | 3.71 | 3.71 | 3.71 |
|
|
