InterfaceInc TILE full analysis,charts,indicators,moving averages,SMA,DMA,EMA,ADX,MACD,RSIInterface Inc TILE WideScreen charts, DMA,SMA,EMA technical analysis, forecast prediction, by indicators ADX,MACD,RSI,CCI NASDAQ stock exchange
operates under Consumer Durables sector & deals in Home Furnishings
Daily price and charts and targets InterfaceInc Strong Daily Stock price targets for InterfaceInc TILE are 26.81 and 27.6 | Daily Target 1 | 26.64 | | Daily Target 2 | 26.98 | | Daily Target 3 | 27.43 | | Daily Target 4 | 27.77 | | Daily Target 5 | 28.22 |
Daily price and volume Interface Inc
| Date |
Closing |
Open |
Range |
Volume |
Fri 05 December 2025 |
27.32 (-1.73%) |
27.88 |
27.09 - 27.88 |
1.0355 times |
Thu 04 December 2025 |
27.80 (-0.57%) |
27.98 |
27.60 - 28.31 |
1.0023 times |
Wed 03 December 2025 |
27.96 (0.61%) |
27.85 |
27.74 - 28.45 |
1.0203 times |
Tue 02 December 2025 |
27.79 (-0.57%) |
28.25 |
27.61 - 28.25 |
0.7761 times |
Mon 01 December 2025 |
27.95 (0.14%) |
27.58 |
27.52 - 28.23 |
1.1585 times |
Fri 28 November 2025 |
27.91 (0.25%) |
27.84 |
27.68 - 27.95 |
0.3883 times |
Wed 26 November 2025 |
27.84 (-0.04%) |
27.69 |
27.69 - 28.14 |
1.773 times |
Tue 25 November 2025 |
27.85 (3.3%) |
27.20 |
27.18 - 27.95 |
0.8277 times |
Mon 24 November 2025 |
26.96 (0.6%) |
26.70 |
26.24 - 27.11 |
0.8499 times |
Fri 21 November 2025 |
26.80 (4.85%) |
25.58 |
25.58 - 27.03 |
1.1686 times |
Thu 20 November 2025 |
25.56 (-0.51%) |
26.13 |
25.39 - 26.49 |
0.9527 times |
Weekly price and charts InterfaceInc Strong weekly Stock price targets for InterfaceInc TILE are 26.53 and 27.89 | Weekly Target 1 | 26.26 | | Weekly Target 2 | 26.79 | | Weekly Target 3 | 27.62 | | Weekly Target 4 | 28.15 | | Weekly Target 5 | 28.98 |
Weekly price and volumes for Interface Inc
| Date |
Closing |
Open |
Range |
Volume |
Fri 05 December 2025 |
27.32 (-2.11%) |
27.58 |
27.09 - 28.45 |
0.9232 times |
Fri 28 November 2025 |
27.91 (4.14%) |
26.70 |
26.24 - 28.14 |
0.7098 times |
Fri 21 November 2025 |
26.80 (3.32%) |
26.01 |
25.30 - 27.03 |
1.0391 times |
Fri 14 November 2025 |
25.94 (0.7%) |
26.02 |
25.24 - 26.82 |
1.1368 times |
Fri 07 November 2025 |
25.76 (3.45%) |
25.98 |
25.31 - 26.62 |
1.267 times |
Fri 31 October 2025 |
24.90 (0%) |
28.17 |
24.49 - 28.70 |
0.4909 times |
Fri 31 October 2025 |
24.90 (-11.45%) |
28.11 |
24.49 - 28.70 |
1.2099 times |
Fri 24 October 2025 |
28.12 (3.53%) |
27.42 |
27.26 - 28.48 |
0.8223 times |
Fri 17 October 2025 |
27.16 (3.59%) |
26.63 |
26.16 - 27.31 |
1.0896 times |
Fri 10 October 2025 |
26.22 (-5.1%) |
27.68 |
26.20 - 27.70 |
1.3114 times |
Fri 03 October 2025 |
27.63 (-2.68%) |
28.61 |
27.56 - 29.00 |
1.2802 times |

Monthly price and charts InterfaceInc Strong monthly Stock price targets for InterfaceInc TILE are 26.53 and 27.89 | Monthly Target 1 | 26.26 | | Monthly Target 2 | 26.79 | | Monthly Target 3 | 27.62 | | Monthly Target 4 | 28.15 | | Monthly Target 5 | 28.98 |
Monthly price and volumes Interface Inc
| Date |
Closing |
Open |
Range |
Volume |
Fri 05 December 2025 |
27.32 (-2.11%) |
27.58 |
27.09 - 28.45 |
0.2012 times |
Fri 28 November 2025 |
27.91 (12.09%) |
25.98 |
25.24 - 28.14 |
0.9051 times |
Fri 31 October 2025 |
24.90 (-13.96%) |
28.75 |
24.49 - 28.80 |
1.2291 times |
Tue 30 September 2025 |
28.94 (8.31%) |
26.32 |
26.11 - 30.20 |
1.3288 times |
Fri 29 August 2025 |
26.72 (29.58%) |
23.97 |
23.37 - 27.33 |
1.0379 times |
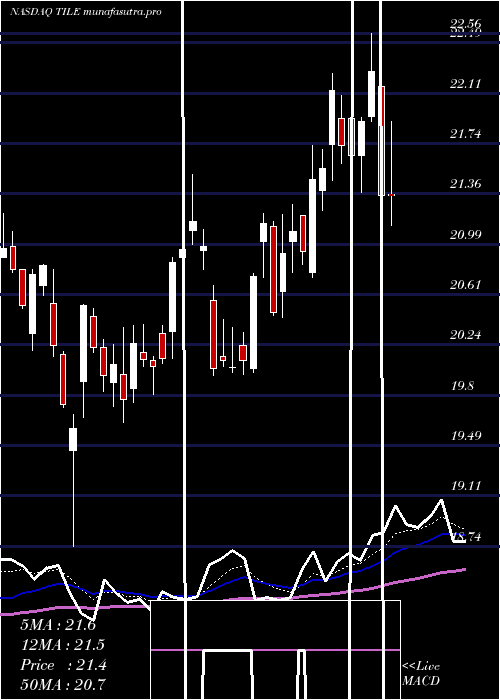
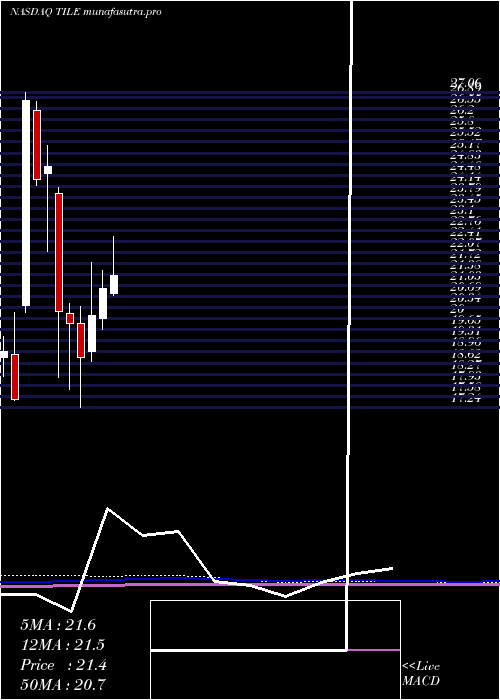
Thu 31 July 2025 |
20.62 (-1.48%) |
20.78 |
20.37 - 22.56 |
0.8214 times |
Mon 30 June 2025 |
20.93 (4.18%) |
20.02 |
19.66 - 21.51 |
0.7961 times |
Fri 30 May 2025 |
20.09 (6.86%) |
18.97 |
18.68 - 21.76 |
0.9374 times |
Wed 30 April 2025 |
18.80 (-5.24%) |
19.84 |
17.24 - 20.39 |
1.0994 times |
Mon 31 March 2025 |
19.84 (-1.93%) |
20.16 |
17.80 - 20.48 |
1.6435 times |
Fri 28 February 2025 |
20.23 (-18.3%) |
23.90 |
18.17 - 24.10 |
1.3656 times |
DMA SMA EMA moving averages of Interface Inc TILE
DMA (daily moving average) of Interface Inc TILE
| DMA period | DMA value | | 5 day DMA | 27.76 | | 12 day DMA | 27.29 | | 20 day DMA | 26.76 | | 35 day DMA | 26.81 | | 50 day DMA | 27.01 | | 100 day DMA | 26.43 | | 150 day DMA | 24.51 | | 200 day DMA | 23.16 | EMA (exponential moving average) of Interface Inc TILE
| EMA period | EMA current | EMA prev | EMA prev2 | | 5 day EMA | 27.62 | 27.77 | 27.76 | | 12 day EMA | 27.35 | 27.35 | 27.27 | | 20 day EMA | 27.12 | 27.1 | 27.03 | | 35 day EMA | 27.15 | 27.14 | 27.1 | | 50 day EMA | 27.25 | 27.25 | 27.23 |
SMA (simple moving average) of Interface Inc TILE
| SMA period | SMA current | SMA prev | SMA prev2 | | 5 day SMA | 27.76 | 27.88 | 27.89 | | 12 day SMA | 27.29 | 27.13 | 26.93 | | 20 day SMA | 26.76 | 26.68 | 26.6 | | 35 day SMA | 26.81 | 26.81 | 26.79 | | 50 day SMA | 27.01 | 27.03 | 27.05 | | 100 day SMA | 26.43 | 26.37 | 26.3 | | 150 day SMA | 24.51 | 24.45 | 24.39 | | 200 day SMA | 23.16 | 23.13 | 23.11 |
|
|
