MillicomInternational TIGO full analysis,charts,indicators,moving averages,SMA,DMA,EMA,ADX,MACD,RSIMillicom International TIGO WideScreen charts, DMA,SMA,EMA technical analysis, forecast prediction, by indicators ADX,MACD,RSI,CCI NASDAQ stock exchange
operates under Public Utilities sector & deals in Telecommunications Equipment
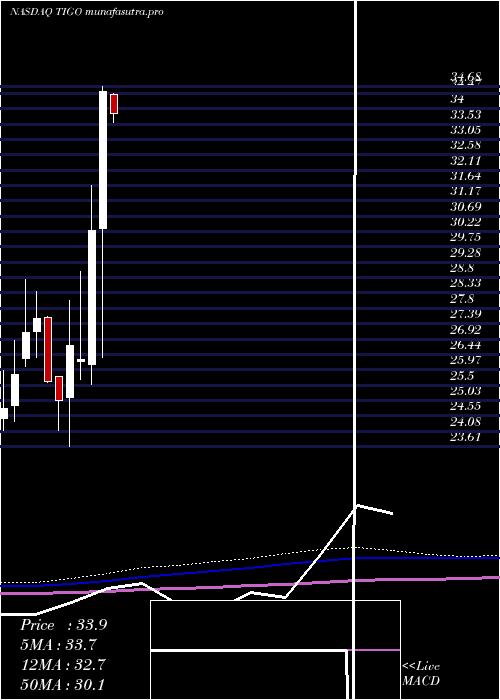
Daily price and charts and targets MillicomInternational Strong Daily Stock price targets for MillicomInternational TIGO are 38.13 and 39.09 | Daily Target 1 | 37.87 | | Daily Target 2 | 38.38 | | Daily Target 3 | 38.83 | | Daily Target 4 | 39.34 | | Daily Target 5 | 39.79 |
Daily price and volume Millicom International
| Date |
Closing |
Open |
Range |
Volume |
Tue 15 July 2025 |
38.89 (-0.31%) |
39.01 |
38.32 - 39.28 |
1.0755 times |
Mon 14 July 2025 |
39.01 (2.96%) |
38.30 |
37.94 - 39.16 |
1.9589 times |
Fri 11 July 2025 |
37.89 (1.2%) |
37.57 |
37.32 - 38.13 |
0.6083 times |
Thu 10 July 2025 |
37.44 (0.67%) |
37.30 |
37.05 - 37.77 |
0.7616 times |
Wed 09 July 2025 |
37.19 (0.4%) |
37.04 |
36.72 - 37.60 |
1.0924 times |
Tue 08 July 2025 |
37.04 (-3.47%) |
37.42 |
36.59 - 37.52 |
0.7699 times |
Mon 07 July 2025 |
38.37 (1.24%) |
37.90 |
37.90 - 38.92 |
1.0538 times |
Thu 03 July 2025 |
37.90 (-0.6%) |
38.13 |
37.68 - 38.47 |
0.9448 times |
Wed 02 July 2025 |
38.13 (1.6%) |
37.43 |
36.99 - 38.43 |
0.9722 times |
Tue 01 July 2025 |
37.53 (0.16%) |
37.80 |
37.19 - 38.14 |
0.7623 times |
Mon 30 June 2025 |
37.47 (3.11%) |
36.36 |
36.36 - 37.83 |
0.9038 times |
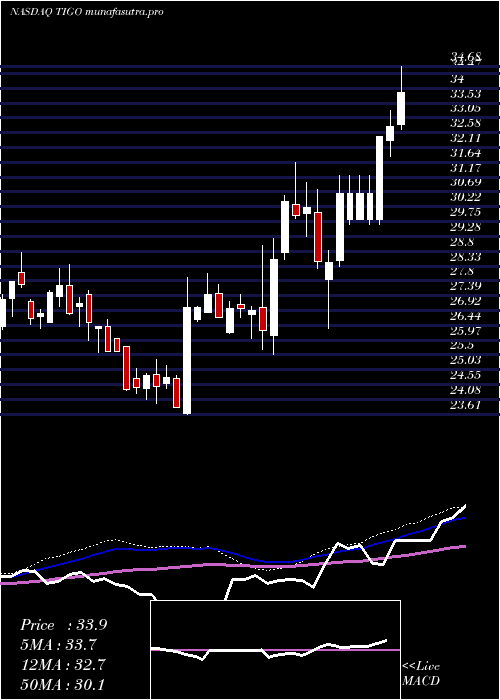
Weekly price and charts MillicomInternational Strong weekly Stock price targets for MillicomInternational TIGO are 38.42 and 39.76 | Weekly Target 1 | 37.36 | | Weekly Target 2 | 38.13 | | Weekly Target 3 | 38.703333333333 | | Weekly Target 4 | 39.47 | | Weekly Target 5 | 40.04 |
Weekly price and volumes for Millicom International
| Date |
Closing |
Open |
Range |
Volume |
Tue 15 July 2025 |
38.89 (2.64%) |
38.30 |
37.94 - 39.28 |
0.8334 times |
Fri 11 July 2025 |
37.89 (-0.03%) |
37.90 |
36.59 - 38.92 |
1.1772 times |
Thu 03 July 2025 |
37.90 (4.29%) |
36.36 |
36.36 - 38.47 |
0.9842 times |
Fri 27 June 2025 |
36.34 (1.14%) |
36.00 |
35.80 - 37.10 |
2.7321 times |
Fri 20 June 2025 |
35.93 (-4.64%) |
37.77 |
35.62 - 38.01 |
0.4863 times |
Fri 13 June 2025 |
37.68 (3.18%) |
36.58 |
35.81 - 38.06 |
0.6605 times |
Fri 06 June 2025 |
36.52 (-2.64%) |
37.39 |
36.24 - 38.09 |
0.7018 times |
Fri 30 May 2025 |
37.51 (1.68%) |
38.01 |
35.49 - 38.50 |
0.8441 times |
Fri 23 May 2025 |
36.89 (2.3%) |
36.15 |
36.08 - 37.31 |
0.7326 times |
Fri 16 May 2025 |
36.06 (3.47%) |
35.00 |
33.74 - 36.29 |
0.8477 times |
Fri 09 May 2025 |
34.85 (4.12%) |
33.47 |
30.26 - 35.47 |
0.8893 times |
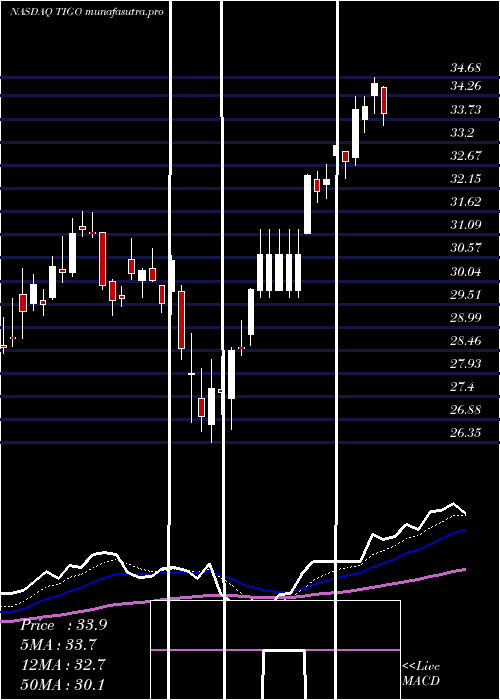
Monthly price and charts MillicomInternational Strong monthly Stock price targets for MillicomInternational TIGO are 37.74 and 40.43 | Monthly Target 1 | 35.56 | | Monthly Target 2 | 37.23 | | Monthly Target 3 | 38.253333333333 | | Monthly Target 4 | 39.92 | | Monthly Target 5 | 40.94 |
Monthly price and volumes Millicom International
| Date |
Closing |
Open |
Range |
Volume |
Tue 15 July 2025 |
38.89 (3.79%) |
37.80 |
36.59 - 39.28 |
1.0015 times |
Mon 30 June 2025 |
37.47 (-0.11%) |
37.39 |
35.62 - 38.09 |
1.7609 times |
Fri 30 May 2025 |
37.51 (8.6%) |
34.44 |
30.26 - 38.50 |
1.3033 times |
Wed 30 April 2025 |
34.54 (14.11%) |
30.32 |
26.35 - 34.68 |
1.8879 times |
Mon 31 March 2025 |
30.27 (15.18%) |
26.12 |
25.50 - 31.63 |
2.2064 times |
Fri 28 February 2025 |
26.28 (-1.57%) |
26.23 |
25.66 - 28.98 |
0.7172 times |
Fri 31 January 2025 |
26.70 (6.76%) |
25.12 |
23.61 - 28.09 |
0.6475 times |
Tue 31 December 2024 |
25.01 (-2.34%) |
25.77 |
24.09 - 25.77 |
0.1835 times |
Tue 26 November 2024 |
25.61 (-7.08%) |
27.59 |
25.59 - 27.61 |
0.1404 times |
Thu 31 October 2024 |
27.56 (1.62%) |
27.15 |
26.36 - 28.38 |
0.1514 times |
Mon 30 September 2024 |
27.12 (5.03%) |
26.32 |
26.06 - 28.75 |
0.1131 times |
DMA SMA EMA moving averages of Millicom International TIGO
DMA (daily moving average) of Millicom International TIGO
| DMA period | DMA value | | 5 day DMA | 38.08 | | 12 day DMA | 37.77 | | 20 day DMA | 37.32 | | 35 day DMA | 37.06 | | 50 day DMA | 36.43 | | 100 day DMA | 33.02 | | 150 day DMA | 30.63 | | 200 day DMA | 29.74 | EMA (exponential moving average) of Millicom International TIGO
| EMA period | EMA current | EMA prev | EMA prev2 | | 5 day EMA | 38.34 | 38.06 | 37.59 | | 12 day EMA | 37.83 | 37.64 | 37.39 | | 20 day EMA | 37.47 | 37.32 | 37.14 | | 35 day EMA | 36.87 | 36.75 | 36.62 | | 50 day EMA | 36.37 | 36.27 | 36.16 |
SMA (simple moving average) of Millicom International TIGO
| SMA period | SMA current | SMA prev | SMA prev2 | | 5 day SMA | 38.08 | 37.71 | 37.59 | | 12 day SMA | 37.77 | 37.53 | 37.32 | | 20 day SMA | 37.32 | 37.23 | 37.11 | | 35 day SMA | 37.06 | 37 | 36.93 | | 50 day SMA | 36.43 | 36.34 | 36.24 | | 100 day SMA | 33.02 | 32.89 | 32.77 | | 150 day SMA | 30.63 | 30.54 | 30.45 | | 200 day SMA | 29.74 | 29.68 | 29.61 |
|
|
