TgTherapeutics TGTX full analysis,charts,indicators,moving averages,SMA,DMA,EMA,ADX,MACD,RSITg Therapeutics TGTX WideScreen charts, DMA,SMA,EMA technical analysis, forecast prediction, by indicators ADX,MACD,RSI,CCI NASDAQ stock exchange
operates under Health Care sector & deals in Major Pharmaceuticals
Daily price and charts and targets TgTherapeutics Strong Daily Stock price targets for TgTherapeutics TGTX are 36.76 and 37.39 | Daily Target 1 | 36.65 | | Daily Target 2 | 36.87 | | Daily Target 3 | 37.283333333333 | | Daily Target 4 | 37.5 | | Daily Target 5 | 37.91 |
Daily price and volume Tg Therapeutics
| Date |
Closing |
Open |
Range |
Volume |
Fri 11 July 2025 |
37.08 (-1.57%) |
37.45 |
37.07 - 37.70 |
0.6247 times |
Thu 10 July 2025 |
37.67 (-0.66%) |
37.57 |
37.38 - 38.39 |
0.8723 times |
Wed 09 July 2025 |
37.92 (6.49%) |
35.99 |
35.43 - 37.94 |
1.2153 times |
Tue 08 July 2025 |
35.61 (-1.03%) |
36.09 |
34.36 - 36.48 |
1.5037 times |
Mon 07 July 2025 |
35.98 (-2.02%) |
36.60 |
35.52 - 36.91 |
0.8186 times |
Thu 03 July 2025 |
36.72 (1.18%) |
36.36 |
36.07 - 36.96 |
0.4444 times |
Wed 02 July 2025 |
36.29 (2.51%) |
35.27 |
35.03 - 36.35 |
0.9044 times |
Tue 01 July 2025 |
35.40 (-1.64%) |
35.76 |
35.10 - 36.91 |
0.9968 times |
Mon 30 June 2025 |
35.99 (-1.99%) |
36.85 |
35.74 - 37.22 |
1.0091 times |
Fri 27 June 2025 |
36.72 (-3.24%) |
37.95 |
36.50 - 38.08 |
1.6107 times |
Thu 26 June 2025 |
37.95 (1.85%) |
37.36 |
36.86 - 37.98 |
0.6566 times |
Weekly price and charts TgTherapeutics Strong weekly Stock price targets for TgTherapeutics TGTX are 35.72 and 39.75 | Weekly Target 1 | 32.58 | | Weekly Target 2 | 34.83 | | Weekly Target 3 | 36.61 | | Weekly Target 4 | 38.86 | | Weekly Target 5 | 40.64 |
Weekly price and volumes for Tg Therapeutics
| Date |
Closing |
Open |
Range |
Volume |
Fri 11 July 2025 |
37.08 (0.98%) |
36.60 |
34.36 - 38.39 |
0.7881 times |
Thu 03 July 2025 |
36.72 (0%) |
36.85 |
35.03 - 37.22 |
0.5252 times |
Fri 27 June 2025 |
36.72 (1.94%) |
36.20 |
35.18 - 38.08 |
0.7972 times |
Fri 20 June 2025 |
36.02 (0.03%) |
35.06 |
34.03 - 36.31 |
0.6211 times |
Fri 13 June 2025 |
36.01 (-10.11%) |
40.61 |
35.88 - 40.99 |
0.9542 times |
Fri 06 June 2025 |
40.06 (14.1%) |
35.05 |
34.32 - 40.54 |
0.9543 times |
Fri 30 May 2025 |
35.11 (1.56%) |
35.04 |
34.34 - 36.06 |
0.5926 times |
Fri 23 May 2025 |
34.57 (0.61%) |
34.00 |
33.56 - 35.62 |
0.7642 times |
Fri 16 May 2025 |
34.36 (2.14%) |
33.46 |
32.68 - 35.30 |
1.2377 times |
Fri 09 May 2025 |
33.64 (-22.56%) |
39.76 |
33.15 - 40.48 |
2.7653 times |
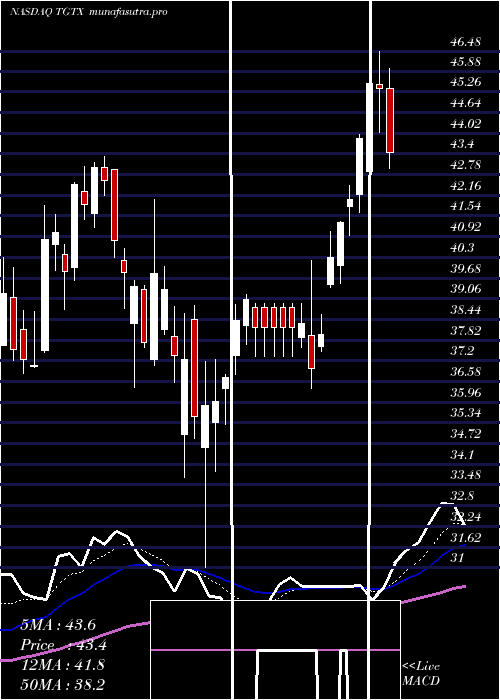
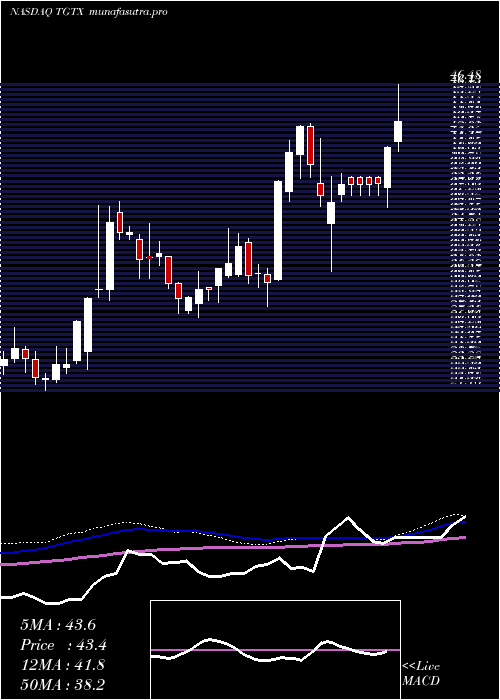
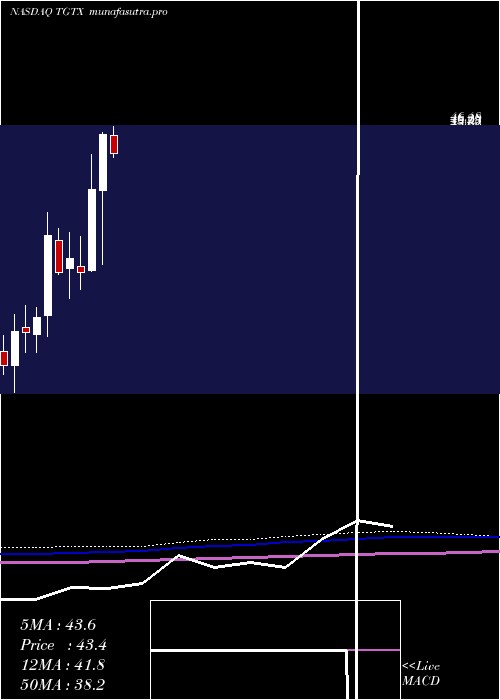
Fri 02 May 2025 |
43.44 (5.11%) |
41.82 |
40.95 - 46.48 |
1.4771 times |
Monthly price and charts TgTherapeutics Strong monthly Stock price targets for TgTherapeutics TGTX are 35.72 and 39.75 | Monthly Target 1 | 32.58 | | Monthly Target 2 | 34.83 | | Monthly Target 3 | 36.61 | | Monthly Target 4 | 38.86 | | Monthly Target 5 | 40.64 |
Monthly price and volumes Tg Therapeutics
| Date |
Closing |
Open |
Range |
Volume |
Fri 11 July 2025 |
37.08 (3.03%) |
35.76 |
34.36 - 38.39 |
0.2283 times |
Mon 30 June 2025 |
35.99 (2.51%) |
35.05 |
34.03 - 40.99 |
0.6886 times |
Fri 30 May 2025 |
35.11 (-22.85%) |
45.49 |
32.68 - 46.48 |
1.1946 times |
Wed 30 April 2025 |
45.51 (15.42%) |
39.34 |
31.00 - 45.83 |
1.1603 times |
Mon 31 March 2025 |
39.43 (31.04%) |
30.33 |
30.28 - 43.32 |
1.4634 times |
Fri 28 February 2025 |
30.09 (-5.08%) |
30.78 |
28.17 - 34.20 |
0.6182 times |
Fri 31 January 2025 |
31.70 (5.32%) |
30.53 |
27.24 - 34.58 |
1.1783 times |
Tue 31 December 2024 |
30.10 (-12.14%) |
33.71 |
29.90 - 35.03 |
0.5898 times |
Tue 26 November 2024 |
34.26 (36.71%) |
25.28 |
22.92 - 36.84 |
1.7636 times |
Thu 31 October 2024 |
25.06 (7.14%) |
23.23 |
21.16 - 26.23 |
1.1147 times |
Mon 30 September 2024 |
23.39 (-0.43%) |
23.92 |
21.11 - 26.41 |
1.9307 times |
DMA SMA EMA moving averages of Tg Therapeutics TGTX
DMA (daily moving average) of Tg Therapeutics TGTX
| DMA period | DMA value | | 5 day DMA | 36.85 | | 12 day DMA | 36.72 | | 20 day DMA | 36.62 | | 35 day DMA | 36.57 | | 50 day DMA | 36.75 | | 100 day DMA | 36.9 | | 150 day DMA | 35.03 | | 200 day DMA | 32.72 | EMA (exponential moving average) of Tg Therapeutics TGTX
| EMA period | EMA current | EMA prev | EMA prev2 | | 5 day EMA | 37.03 | 37 | 36.67 | | 12 day EMA | 36.81 | 36.76 | 36.59 | | 20 day EMA | 36.8 | 36.77 | 36.67 | | 35 day EMA | 36.83 | 36.82 | 36.77 | | 50 day EMA | 37.02 | 37.02 | 36.99 |
SMA (simple moving average) of Tg Therapeutics TGTX
| SMA period | SMA current | SMA prev | SMA prev2 | | 5 day SMA | 36.85 | 36.78 | 36.5 | | 12 day SMA | 36.72 | 36.73 | 36.64 | | 20 day SMA | 36.62 | 36.73 | 36.84 | | 35 day SMA | 36.57 | 36.51 | 36.41 | | 50 day SMA | 36.75 | 36.85 | 36.92 | | 100 day SMA | 36.9 | 36.84 | 36.77 | | 150 day SMA | 35.03 | 35.01 | 35 | | 200 day SMA | 32.72 | 32.66 | 32.59 |
|
|
