TfsFinancial TFSL full analysis,charts,indicators,moving averages,SMA,DMA,EMA,ADX,MACD,RSITfs Financial TFSL WideScreen charts, DMA,SMA,EMA technical analysis, forecast prediction, by indicators ADX,MACD,RSI,CCI NASDAQ stock exchange
operates under Finance sector & deals in Savings Institutions
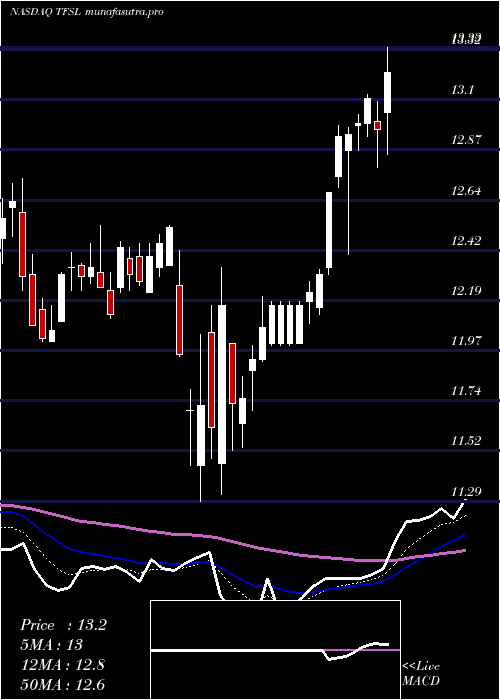
Daily price and charts and targets TfsFinancial Strong Daily Stock price targets for TfsFinancial TFSL are 14.09 and 14.25 | Daily Target 1 | 13.97 | | Daily Target 2 | 14.04 | | Daily Target 3 | 14.13 | | Daily Target 4 | 14.2 | | Daily Target 5 | 14.29 |
Daily price and volume Tfs Financial
| Date |
Closing |
Open |
Range |
Volume |
Fri 05 December 2025 |
14.11 (-0.14%) |
14.08 |
14.06 - 14.22 |
0.7562 times |
Thu 04 December 2025 |
14.13 (0.21%) |
14.08 |
14.04 - 14.23 |
1.1903 times |
Wed 03 December 2025 |
14.10 (0.86%) |
13.97 |
13.97 - 14.18 |
1.2941 times |
Tue 02 December 2025 |
13.98 (-2.98%) |
14.13 |
13.93 - 14.15 |
1.1893 times |
Mon 01 December 2025 |
14.41 (1.12%) |
14.19 |
14.19 - 14.49 |
1.4102 times |
Fri 28 November 2025 |
14.25 (-1.11%) |
14.47 |
14.24 - 14.47 |
0.4283 times |
Wed 26 November 2025 |
14.41 (-0.48%) |
14.49 |
14.33 - 14.53 |
0.8159 times |
Tue 25 November 2025 |
14.48 (1.47%) |
14.35 |
14.34 - 14.73 |
1.0365 times |
Mon 24 November 2025 |
14.27 (0.49%) |
14.20 |
14.13 - 14.35 |
0.9504 times |
Fri 21 November 2025 |
14.20 (4.03%) |
13.68 |
13.68 - 14.28 |
0.929 times |
Thu 20 November 2025 |
13.65 (0.74%) |
13.61 |
13.53 - 13.81 |
0.5962 times |
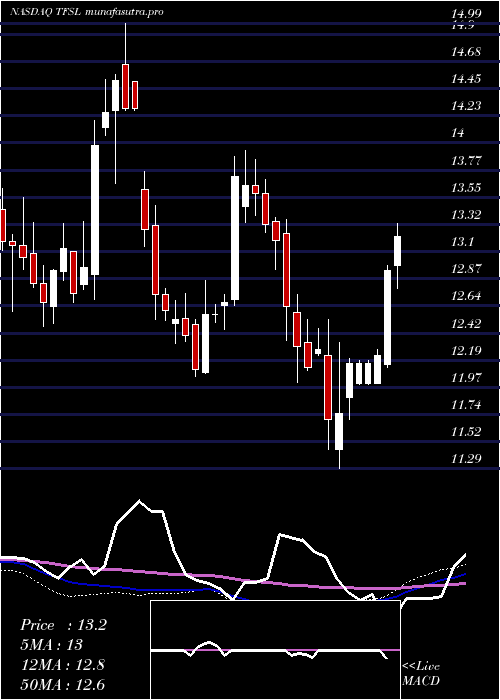
Weekly price and charts TfsFinancial Strong weekly Stock price targets for TfsFinancial TFSL are 13.74 and 14.3 | Weekly Target 1 | 13.62 | | Weekly Target 2 | 13.86 | | Weekly Target 3 | 14.176666666667 | | Weekly Target 4 | 14.42 | | Weekly Target 5 | 14.74 |
Weekly price and volumes for Tfs Financial
| Date |
Closing |
Open |
Range |
Volume |
Fri 05 December 2025 |
14.11 (-0.98%) |
14.19 |
13.93 - 14.49 |
1.896 times |
Fri 28 November 2025 |
14.25 (0.35%) |
14.20 |
14.13 - 14.73 |
1.049 times |
Fri 21 November 2025 |
14.20 (3.88%) |
13.60 |
13.21 - 14.28 |
1.1195 times |
Fri 14 November 2025 |
13.67 (-0.87%) |
13.80 |
13.56 - 14.03 |
0.8661 times |
Fri 07 November 2025 |
13.79 (3.68%) |
13.62 |
13.40 - 13.80 |
0.7576 times |
Fri 31 October 2025 |
13.30 (0%) |
13.45 |
13.21 - 13.84 |
0.3083 times |
Fri 31 October 2025 |
13.30 (-2.28%) |
13.66 |
13.18 - 13.84 |
1.1841 times |
Fri 24 October 2025 |
13.61 (5.34%) |
12.99 |
12.91 - 13.65 |
0.8619 times |
Fri 17 October 2025 |
12.92 (-0.39%) |
13.10 |
12.53 - 13.60 |
1.1362 times |
Fri 10 October 2025 |
12.97 (-2.92%) |
13.45 |
12.97 - 13.82 |
0.8214 times |
Fri 03 October 2025 |
13.36 (1.06%) |
13.24 |
13.01 - 13.54 |
0.769 times |
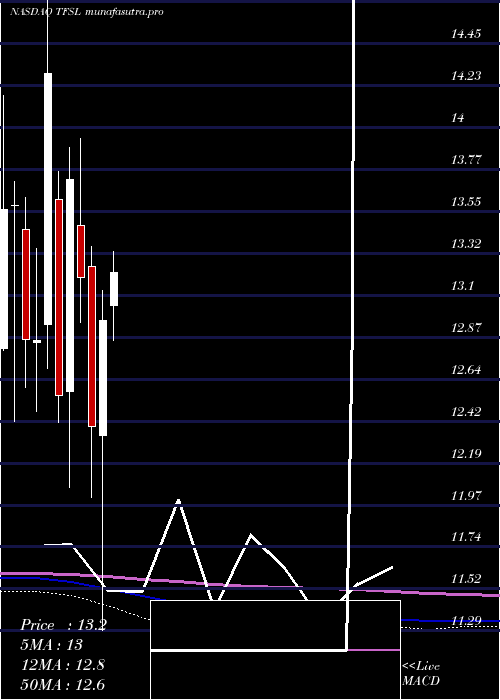
Monthly price and charts TfsFinancial Strong monthly Stock price targets for TfsFinancial TFSL are 13.74 and 14.3 | Monthly Target 1 | 13.62 | | Monthly Target 2 | 13.86 | | Monthly Target 3 | 14.176666666667 | | Monthly Target 4 | 14.42 | | Monthly Target 5 | 14.74 |
Monthly price and volumes Tfs Financial
| Date |
Closing |
Open |
Range |
Volume |
Fri 05 December 2025 |
14.11 (-0.98%) |
14.19 |
13.93 - 14.49 |
0.5451 times |
Fri 28 November 2025 |
14.25 (7.14%) |
13.62 |
13.21 - 14.73 |
1.0903 times |
Fri 31 October 2025 |
13.30 (0.91%) |
13.12 |
12.53 - 13.84 |
1.3634 times |
Tue 30 September 2025 |
13.18 (-6.26%) |
13.97 |
13.01 - 13.98 |
1.2661 times |
Fri 29 August 2025 |
14.06 (7.25%) |
13.05 |
12.65 - 14.35 |
0.9953 times |
Thu 31 July 2025 |
13.11 (1.24%) |
12.89 |
12.57 - 13.45 |
0.964 times |
Mon 30 June 2025 |
12.95 (-1.97%) |
13.20 |
12.53 - 13.42 |
0.9568 times |
Fri 30 May 2025 |
13.21 (1.93%) |
13.04 |
12.85 - 13.73 |
0.7524 times |
Wed 30 April 2025 |
12.96 (4.6%) |
12.34 |
11.29 - 13.12 |
1.1878 times |
Mon 31 March 2025 |
12.39 (-6.07%) |
13.25 |
12.01 - 13.36 |
0.8788 times |
Fri 28 February 2025 |
13.19 (-3.86%) |
13.47 |
12.95 - 13.94 |
0.6743 times |
DMA SMA EMA moving averages of Tfs Financial TFSL
DMA (daily moving average) of Tfs Financial TFSL
| DMA period | DMA value | | 5 day DMA | 14.15 | | 12 day DMA | 14.13 | | 20 day DMA | 13.95 | | 35 day DMA | 13.72 | | 50 day DMA | 13.58 | | 100 day DMA | 13.42 | | 150 day DMA | 13.34 | | 200 day DMA | 13.12 | EMA (exponential moving average) of Tfs Financial TFSL
| EMA period | EMA current | EMA prev | EMA prev2 | | 5 day EMA | 14.14 | 14.15 | 14.16 | | 12 day EMA | 14.08 | 14.07 | 14.06 | | 20 day EMA | 13.97 | 13.95 | 13.93 | | 35 day EMA | 13.79 | 13.77 | 13.75 | | 50 day EMA | 13.61 | 13.59 | 13.57 |
SMA (simple moving average) of Tfs Financial TFSL
| SMA period | SMA current | SMA prev | SMA prev2 | | 5 day SMA | 14.15 | 14.17 | 14.23 | | 12 day SMA | 14.13 | 14.07 | 14 | | 20 day SMA | 13.95 | 13.92 | 13.9 | | 35 day SMA | 13.72 | 13.68 | 13.65 | | 50 day SMA | 13.58 | 13.56 | 13.55 | | 100 day SMA | 13.42 | 13.41 | 13.39 | | 150 day SMA | 13.34 | 13.33 | 13.32 | | 200 day SMA | 13.12 | 13.12 | 13.12 |
|
|
