TenableHoldings TENB full analysis,charts,indicators,moving averages,SMA,DMA,EMA,ADX,MACD,RSITenable Holdings TENB WideScreen charts, DMA,SMA,EMA technical analysis, forecast prediction, by indicators ADX,MACD,RSI,CCI NASDAQ stock exchange
operates under Technology sector & deals in Computer Software Prepackaged Software
Daily price and charts and targets TenableHoldings Strong Daily Stock price targets for TenableHoldings TENB are 25.79 and 26.72 | Daily Target 1 | 25.59 | | Daily Target 2 | 25.99 | | Daily Target 3 | 26.516666666667 | | Daily Target 4 | 26.92 | | Daily Target 5 | 27.45 |
Daily price and volume Tenable Holdings
| Date |
Closing |
Open |
Range |
Volume |
Fri 05 December 2025 |
26.40 (-0.94%) |
26.62 |
26.11 - 27.04 |
1.7233 times |
Thu 04 December 2025 |
26.65 (-0.6%) |
26.83 |
26.60 - 27.07 |
1.446 times |
Wed 03 December 2025 |
26.81 (1.25%) |
26.42 |
26.24 - 26.88 |
1.2195 times |
Tue 02 December 2025 |
26.48 (0.8%) |
26.55 |
26.32 - 26.73 |
0.7939 times |
Mon 01 December 2025 |
26.27 (-0.94%) |
26.30 |
26.18 - 26.59 |
0.7616 times |
Fri 28 November 2025 |
26.52 (0.95%) |
26.43 |
26.33 - 26.57 |
0.3809 times |
Wed 26 November 2025 |
26.27 (-0.98%) |
26.31 |
26.09 - 26.44 |
0.805 times |
Tue 25 November 2025 |
26.53 (3.31%) |
25.75 |
25.73 - 26.65 |
1.1234 times |
Mon 24 November 2025 |
25.68 (-1.46%) |
26.12 |
25.57 - 26.20 |
0.756 times |
Fri 21 November 2025 |
26.06 (1.6%) |
25.64 |
25.28 - 26.20 |
0.9903 times |
Thu 20 November 2025 |
25.65 (-0.58%) |
26.04 |
25.52 - 26.40 |
1.0568 times |
Weekly price and charts TenableHoldings Strong weekly Stock price targets for TenableHoldings TENB are 26.26 and 27.22 | Weekly Target 1 | 25.57 | | Weekly Target 2 | 25.98 | | Weekly Target 3 | 26.526666666667 | | Weekly Target 4 | 26.94 | | Weekly Target 5 | 27.49 |
Weekly price and volumes for Tenable Holdings
| Date |
Closing |
Open |
Range |
Volume |
Fri 05 December 2025 |
26.40 (-0.45%) |
26.30 |
26.11 - 27.07 |
1.2794 times |
Fri 28 November 2025 |
26.52 (1.77%) |
26.12 |
25.57 - 26.65 |
0.6598 times |
Fri 21 November 2025 |
26.06 (-3.41%) |
26.95 |
25.28 - 27.22 |
1.1313 times |
Fri 14 November 2025 |
26.98 (-2.49%) |
27.82 |
26.53 - 28.39 |
1.0949 times |
Fri 07 November 2025 |
27.67 (-4.65%) |
28.70 |
27.01 - 28.82 |
0.9512 times |
Fri 31 October 2025 |
29.02 (0%) |
28.73 |
28.55 - 29.14 |
0.2811 times |
Fri 31 October 2025 |
29.02 (-4.22%) |
30.30 |
28.46 - 30.69 |
1.5254 times |
Fri 24 October 2025 |
30.30 (4.37%) |
29.19 |
29.19 - 30.67 |
0.8489 times |
Fri 17 October 2025 |
29.03 (-0.1%) |
29.13 |
28.79 - 29.84 |
1.0654 times |
Fri 10 October 2025 |
29.06 (-1.79%) |
29.65 |
28.80 - 29.94 |
1.1626 times |
Fri 03 October 2025 |
29.59 (-0.24%) |
29.84 |
28.71 - 30.07 |
1.2202 times |
Monthly price and charts TenableHoldings Strong monthly Stock price targets for TenableHoldings TENB are 26.26 and 27.22 | Monthly Target 1 | 25.57 | | Monthly Target 2 | 25.98 | | Monthly Target 3 | 26.526666666667 | | Monthly Target 4 | 26.94 | | Monthly Target 5 | 27.49 |
Monthly price and volumes Tenable Holdings
| Date |
Closing |
Open |
Range |
Volume |
Fri 05 December 2025 |
26.40 (-0.45%) |
26.30 |
26.11 - 27.07 |
0.2479 times |
Fri 28 November 2025 |
26.52 (-8.61%) |
28.70 |
25.28 - 28.82 |
0.7434 times |
Fri 31 October 2025 |
29.02 (-0.48%) |
29.08 |
28.46 - 30.69 |
1.105 times |
Tue 30 September 2025 |
29.16 (-5.69%) |
30.43 |
28.93 - 31.27 |
1.0277 times |
Fri 29 August 2025 |
30.92 (-1.25%) |
31.26 |
28.51 - 31.50 |
1.1643 times |
Thu 31 July 2025 |
31.31 (-7.31%) |
33.61 |
31.20 - 35.69 |
1.2132 times |
Mon 30 June 2025 |
33.78 (4.84%) |
32.14 |
31.03 - 34.72 |
1.4788 times |
Fri 30 May 2025 |
32.22 (5.4%) |
30.91 |
30.20 - 33.86 |
1.2279 times |
Wed 30 April 2025 |
30.57 (-12.61%) |
34.60 |
28.75 - 35.39 |
0.9266 times |
Mon 31 March 2025 |
34.98 (-8.29%) |
38.13 |
33.84 - 38.83 |
0.8652 times |
Fri 28 February 2025 |
38.14 (-11.49%) |
42.35 |
37.01 - 43.68 |
0.9023 times |
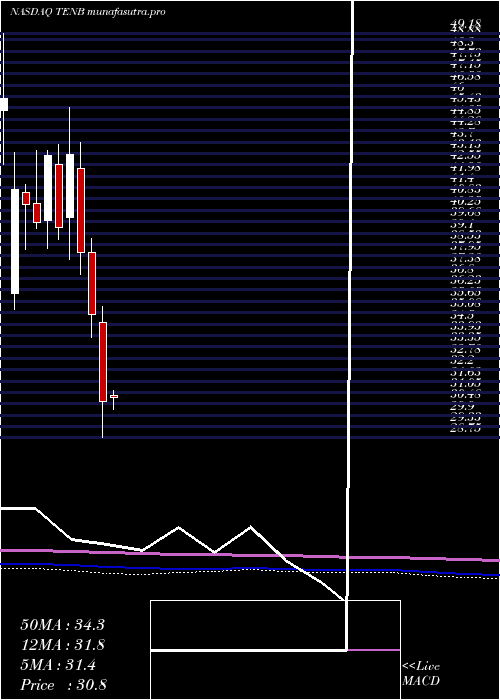
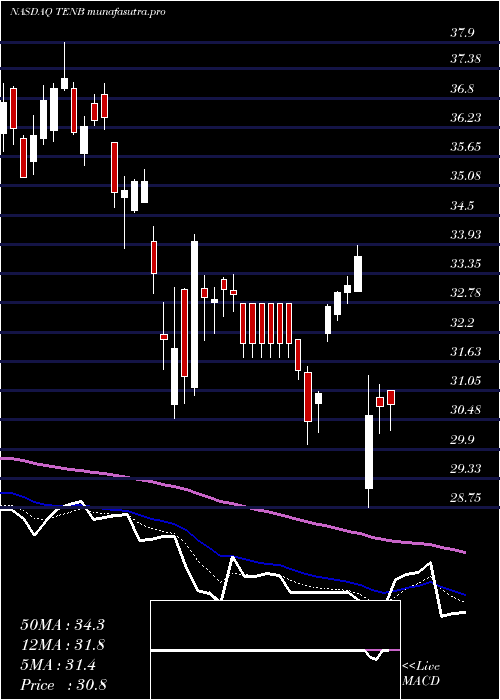
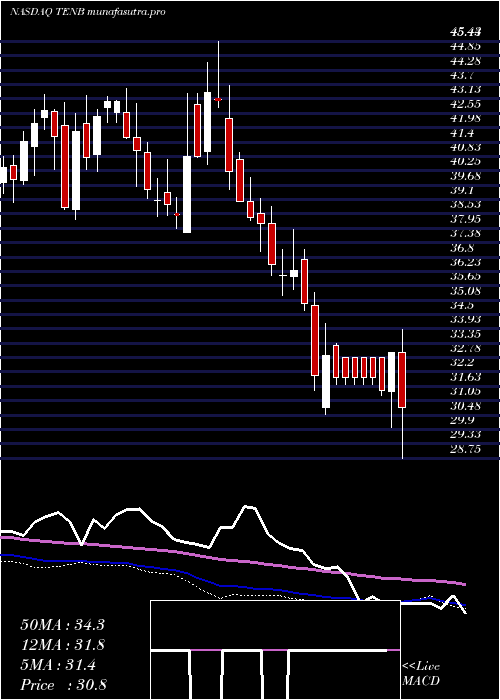
DMA SMA EMA moving averages of Tenable Holdings TENB
DMA (daily moving average) of Tenable Holdings TENB
| DMA period | DMA value | | 5 day DMA | 26.52 | | 12 day DMA | 26.26 | | 20 day DMA | 26.62 | | 35 day DMA | 27.75 | | 50 day DMA | 28.25 | | 100 day DMA | 29.51 | | 150 day DMA | 30.59 | | 200 day DMA | 31.58 | EMA (exponential moving average) of Tenable Holdings TENB
| EMA period | EMA current | EMA prev | EMA prev2 | | 5 day EMA | 26.5 | 26.55 | 26.5 | | 12 day EMA | 26.54 | 26.56 | 26.54 | | 20 day EMA | 26.83 | 26.88 | 26.9 | | 35 day EMA | 27.46 | 27.52 | 27.57 | | 50 day EMA | 28.23 | 28.3 | 28.37 |
SMA (simple moving average) of Tenable Holdings TENB
| SMA period | SMA current | SMA prev | SMA prev2 | | 5 day SMA | 26.52 | 26.55 | 26.47 | | 12 day SMA | 26.26 | 26.21 | 26.16 | | 20 day SMA | 26.62 | 26.66 | 26.71 | | 35 day SMA | 27.75 | 27.83 | 27.91 | | 50 day SMA | 28.25 | 28.31 | 28.38 | | 100 day SMA | 29.51 | 29.58 | 29.64 | | 150 day SMA | 30.59 | 30.62 | 30.64 | | 200 day SMA | 31.58 | 31.64 | 31.7 |
|
|
