TatTechnologies TATT full analysis,charts,indicators,moving averages,SMA,DMA,EMA,ADX,MACD,RSITat Technologies TATT WideScreen charts, DMA,SMA,EMA technical analysis, forecast prediction, by indicators ADX,MACD,RSI,CCI NASDAQ stock exchange
operates under Capital Goods sector & deals in Aerospace
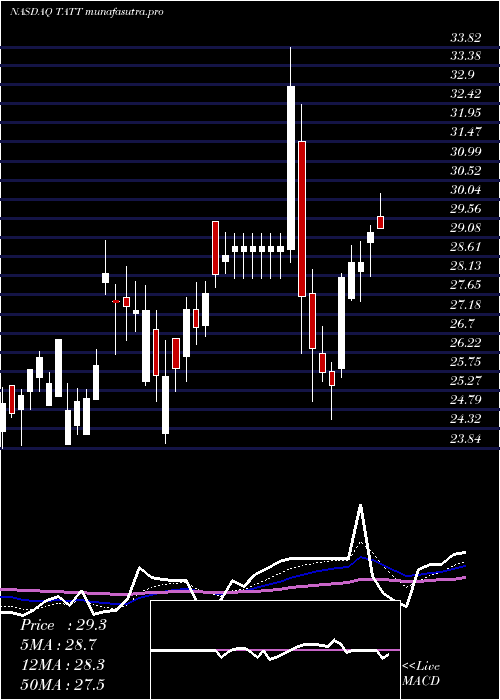
Daily price and charts and targets TatTechnologies Strong Daily Stock price targets for TatTechnologies TATT are 29.03 and 30.17 | Daily Target 1 | 28.77 | | Daily Target 2 | 29.29 | | Daily Target 3 | 29.906666666667 | | Daily Target 4 | 30.43 | | Daily Target 5 | 31.05 |
Daily price and volume Tat Technologies
| Date |
Closing |
Open |
Range |
Volume |
Fri 11 July 2025 |
29.82 (-1.29%) |
30.52 |
29.38 - 30.52 |
0.4316 times |
Thu 10 July 2025 |
30.21 (-1.79%) |
31.07 |
30.10 - 31.12 |
0.5472 times |
Wed 09 July 2025 |
30.76 (-1.44%) |
31.27 |
30.41 - 31.30 |
0.4157 times |
Tue 08 July 2025 |
31.21 (-2.01%) |
31.46 |
30.01 - 31.77 |
0.6242 times |
Mon 07 July 2025 |
31.85 (2.31%) |
31.43 |
30.17 - 31.86 |
1.0246 times |
Thu 03 July 2025 |
31.13 (1.9%) |
30.57 |
30.30 - 31.21 |
0.529 times |
Wed 02 July 2025 |
30.55 (0.99%) |
30.26 |
29.71 - 30.65 |
1.2078 times |
Tue 01 July 2025 |
30.25 (-0.95%) |
31.50 |
29.22 - 31.54 |
2.1478 times |
Mon 30 June 2025 |
30.54 (1.16%) |
30.95 |
30.50 - 31.82 |
1.29 times |
Fri 27 June 2025 |
30.19 (0.43%) |
30.12 |
29.56 - 31.00 |
1.782 times |
Thu 26 June 2025 |
30.06 (4.37%) |
29.05 |
28.81 - 30.54 |
1.2401 times |
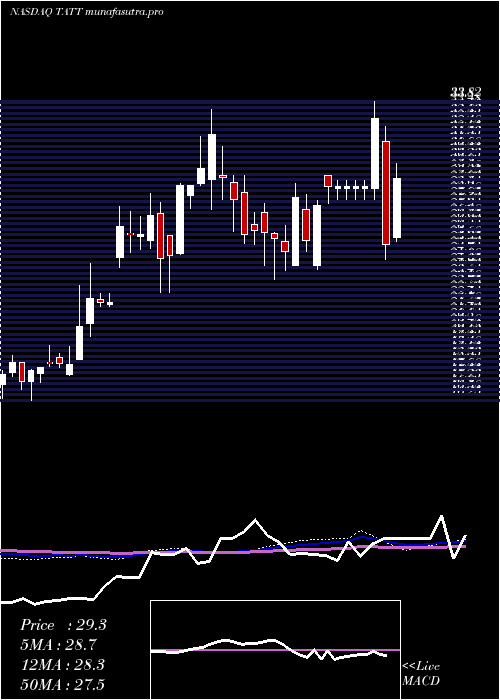
Weekly price and charts TatTechnologies Strong weekly Stock price targets for TatTechnologies TATT are 28.36 and 30.84 | Weekly Target 1 | 27.87 | | Weekly Target 2 | 28.85 | | Weekly Target 3 | 30.353333333333 | | Weekly Target 4 | 31.33 | | Weekly Target 5 | 32.83 |
Weekly price and volumes for Tat Technologies
| Date |
Closing |
Open |
Range |
Volume |
Fri 11 July 2025 |
29.82 (-4.21%) |
31.43 |
29.38 - 31.86 |
0.4769 times |
Thu 03 July 2025 |
31.13 (3.11%) |
30.95 |
29.22 - 31.82 |
0.8109 times |
Fri 27 June 2025 |
30.19 (17.93%) |
26.46 |
26.12 - 31.00 |
1.541 times |
Fri 20 June 2025 |
25.60 (-2.62%) |
26.09 |
25.52 - 27.06 |
0.6321 times |
Fri 13 June 2025 |
26.29 (-3.35%) |
27.00 |
25.58 - 27.12 |
0.6795 times |
Fri 06 June 2025 |
27.20 (4.49%) |
26.08 |
25.90 - 27.67 |
1.3654 times |
Fri 30 May 2025 |
26.03 (-14.18%) |
31.26 |
25.78 - 31.45 |
3.0537 times |
Fri 23 May 2025 |
30.33 (-12.44%) |
34.81 |
29.89 - 35.17 |
0.5587 times |
Fri 16 May 2025 |
34.64 (1.46%) |
32.54 |
29.56 - 35.93 |
0.429 times |
Fri 09 May 2025 |
34.14 (16.48%) |
29.20 |
28.58 - 36.49 |
0.4527 times |
Fri 02 May 2025 |
29.31 (15.39%) |
25.81 |
25.60 - 30.18 |
0.3569 times |
Monthly price and charts TatTechnologies Strong monthly Stock price targets for TatTechnologies TATT are 28.2 and 30.84 | Monthly Target 1 | 27.66 | | Monthly Target 2 | 28.74 | | Monthly Target 3 | 30.3 | | Monthly Target 4 | 31.38 | | Monthly Target 5 | 32.94 |
Monthly price and volumes Tat Technologies
| Date |
Closing |
Open |
Range |
Volume |
Fri 11 July 2025 |
29.82 (-2.36%) |
31.50 |
29.22 - 31.86 |
0.6182 times |
Mon 30 June 2025 |
30.54 (17.33%) |
26.08 |
25.52 - 31.82 |
2.517 times |
Fri 30 May 2025 |
26.03 (-8.54%) |
28.96 |
25.78 - 36.49 |
2.6406 times |
Wed 30 April 2025 |
28.46 (3.57%) |
27.58 |
23.96 - 33.82 |
1.6002 times |
Mon 31 March 2025 |
27.48 (4.65%) |
27.31 |
23.37 - 29.00 |
0.5122 times |
Fri 28 February 2025 |
26.26 (-17.71%) |
29.50 |
25.45 - 31.20 |
0.4615 times |
Fri 31 January 2025 |
31.91 (24.26%) |
26.20 |
22.57 - 33.37 |
0.7513 times |
Tue 31 December 2024 |
25.68 (16.67%) |
24.65 |
24.04 - 27.69 |
0.3386 times |
Tue 26 November 2024 |
22.01 (20.74%) |
18.30 |
17.71 - 24.29 |
0.4073 times |
Thu 31 October 2024 |
18.23 (-0.6%) |
18.17 |
16.25 - 19.47 |
0.153 times |
Mon 30 September 2024 |
18.34 (5.04%) |
16.12 |
15.71 - 18.90 |
0.1863 times |
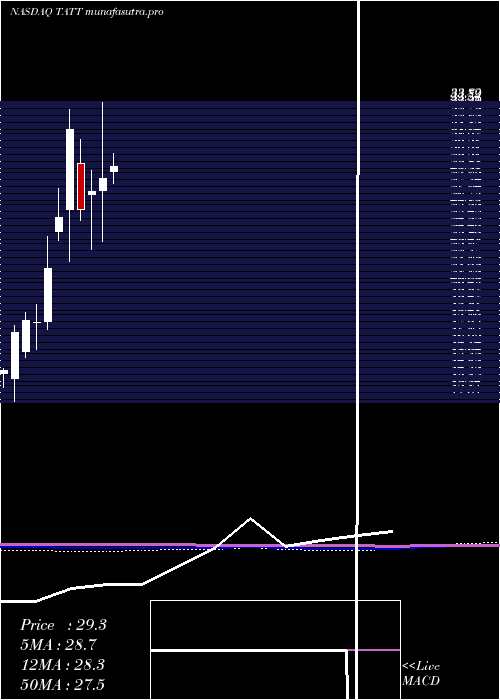
DMA SMA EMA moving averages of Tat Technologies TATT
DMA (daily moving average) of Tat Technologies TATT
| DMA period | DMA value | | 5 day DMA | 30.77 | | 12 day DMA | 30.45 | | 20 day DMA | 28.9 | | 35 day DMA | 28.71 | | 50 day DMA | 29.68 | | 100 day DMA | 28.25 | | 150 day DMA | 28.02 | | 200 day DMA | 25.73 | EMA (exponential moving average) of Tat Technologies TATT
| EMA period | EMA current | EMA prev | EMA prev2 | | 5 day EMA | 30.39 | 30.68 | 30.92 | | 12 day EMA | 30.07 | 30.12 | 30.1 | | 20 day EMA | 29.6 | 29.58 | 29.51 | | 35 day EMA | 29.54 | 29.52 | 29.48 | | 50 day EMA | 29.53 | 29.52 | 29.49 |
SMA (simple moving average) of Tat Technologies TATT
| SMA period | SMA current | SMA prev | SMA prev2 | | 5 day SMA | 30.77 | 31.03 | 31.1 | | 12 day SMA | 30.45 | 30.4 | 30.14 | | 20 day SMA | 28.9 | 28.73 | 28.54 | | 35 day SMA | 28.71 | 28.86 | 28.98 | | 50 day SMA | 29.68 | 29.65 | 29.55 | | 100 day SMA | 28.25 | 28.23 | 28.21 | | 150 day SMA | 28.02 | 27.97 | 27.92 | | 200 day SMA | 25.73 | 25.67 | 25.6 |
|
|
