TantechHoldings TANH full analysis,charts,indicators,moving averages,SMA,DMA,EMA,ADX,MACD,RSITantech Holdings TANH WideScreen charts, DMA,SMA,EMA technical analysis, forecast prediction, by indicators ADX,MACD,RSI,CCI NASDAQ stock exchange
operates under Basic Industries sector & deals in Major Chemicals
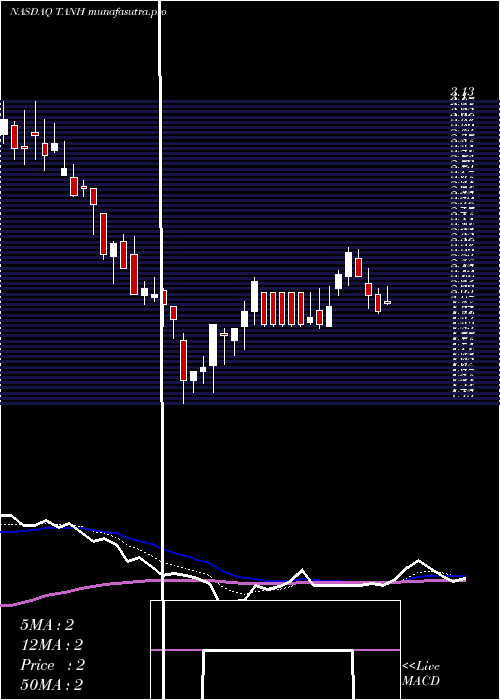
Daily price and charts and targets TantechHoldings Strong Daily Stock price targets for TantechHoldings TANH are 1.94 and 2.01 | Daily Target 1 | 1.9 | | Daily Target 2 | 1.93 | | Daily Target 3 | 1.9666666666667 | | Daily Target 4 | 2 | | Daily Target 5 | 2.04 |
Daily price and volume Tantech Holdings
| Date |
Closing |
Open |
Range |
Volume |
Wed 03 September 2025 |
1.97 (-1.99%) |
1.97 |
1.93 - 2.00 |
0.57 times |
Tue 02 September 2025 |
2.01 (-0.5%) |
2.00 |
1.96 - 2.01 |
0.2076 times |
Fri 29 August 2025 |
2.02 (0%) |
2.02 |
2.00 - 2.02 |
0.0669 times |
Fri 29 August 2025 |
2.02 (-2.42%) |
2.02 |
2.00 - 2.02 |
0.0669 times |
Thu 28 August 2025 |
2.07 (5.08%) |
1.98 |
1.96 - 2.09 |
1.5271 times |
Wed 27 August 2025 |
1.97 (-1.99%) |
1.99 |
1.94 - 2.01 |
0.6087 times |
Tue 26 August 2025 |
2.01 (-5.19%) |
2.06 |
2.00 - 2.12 |
1.8543 times |
Mon 25 August 2025 |
2.12 (4.43%) |
2.00 |
1.99 - 2.12 |
1.2245 times |
Fri 22 August 2025 |
2.03 (5.18%) |
1.95 |
1.95 - 2.05 |
1.513 times |
Thu 21 August 2025 |
1.93 (2.66%) |
1.91 |
1.90 - 1.96 |
2.361 times |
Wed 20 August 2025 |
1.88 (-1.05%) |
1.90 |
1.88 - 1.92 |
0.4046 times |
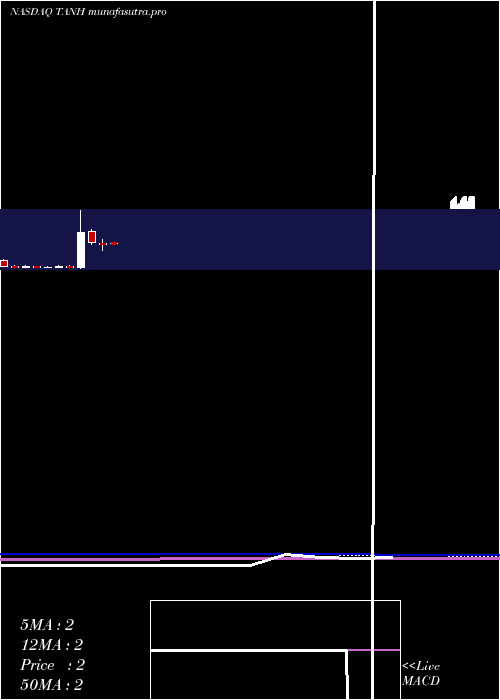
Weekly price and charts TantechHoldings Strong weekly Stock price targets for TantechHoldings TANH are 1.91 and 1.99 | Weekly Target 1 | 1.89 | | Weekly Target 2 | 1.93 | | Weekly Target 3 | 1.97 | | Weekly Target 4 | 2.01 | | Weekly Target 5 | 2.05 |
Weekly price and volumes for Tantech Holdings
| Date |
Closing |
Open |
Range |
Volume |
Wed 03 September 2025 |
1.97 (-2.48%) |
2.00 |
1.93 - 2.01 |
0.0988 times |
Fri 29 August 2025 |
2.02 (0%) |
2.02 |
2.00 - 2.02 |
0.0085 times |
Fri 29 August 2025 |
2.02 (-0.49%) |
2.00 |
1.94 - 2.12 |
0.6708 times |
Fri 22 August 2025 |
2.03 (10.93%) |
1.85 |
1.78 - 2.05 |
0.7941 times |
Fri 15 August 2025 |
1.83 (1.1%) |
1.85 |
1.77 - 1.99 |
0.6694 times |
Fri 08 August 2025 |
1.81 (-7.18%) |
1.98 |
1.72 - 1.99 |
0.2091 times |
Fri 01 August 2025 |
1.95 (-4.41%) |
2.02 |
1.94 - 2.23 |
1.8421 times |
Fri 25 July 2025 |
2.04 (8.51%) |
1.87 |
1.82 - 2.19 |
2.221 times |
Fri 18 July 2025 |
1.88 (-6.47%) |
1.99 |
1.81 - 2.11 |
2.1625 times |
Fri 11 July 2025 |
2.01 (1.01%) |
2.01 |
1.94 - 2.15 |
1.3237 times |
Thu 03 July 2025 |
1.99 (-0.5%) |
1.98 |
1.96 - 2.14 |
1.1851 times |
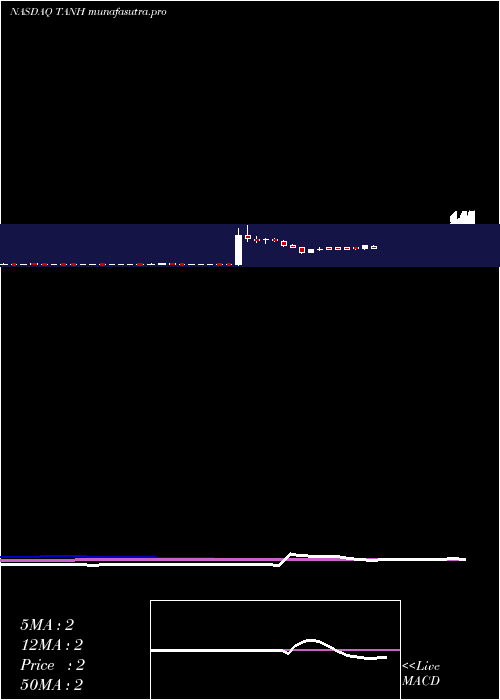
Monthly price and charts TantechHoldings Strong monthly Stock price targets for TantechHoldings TANH are 1.91 and 1.99 | Monthly Target 1 | 1.89 | | Monthly Target 2 | 1.93 | | Monthly Target 3 | 1.97 | | Monthly Target 4 | 2.01 | | Monthly Target 5 | 2.05 |
Monthly price and volumes Tantech Holdings
| Date |
Closing |
Open |
Range |
Volume |
Wed 03 September 2025 |
1.97 (-2.48%) |
2.00 |
1.93 - 2.01 |
0.0006 times |
Fri 29 August 2025 |
2.02 (0.5%) |
2.01 |
1.72 - 2.12 |
0.0162 times |
Thu 31 July 2025 |
2.01 (2.55%) |
2.11 |
1.81 - 2.23 |
0.0464 times |
Mon 30 June 2025 |
1.96 (-11.71%) |
2.10 |
1.93 - 2.26 |
0.0156 times |
Fri 30 May 2025 |
2.22 (13.27%) |
2.02 |
1.90 - 4.05 |
0.245 times |
Wed 30 April 2025 |
1.96 (-6.22%) |
2.04 |
1.45 - 2.32 |
0.0234 times |
Mon 31 March 2025 |
2.09 (-28.18%) |
3.00 |
2.00 - 3.13 |
0.0267 times |
Fri 28 February 2025 |
2.91 (1840%) |
0.15 |
0.08 - 4.64 |
1.0012 times |
Fri 31 January 2025 |
0.15 (-28.57%) |
0.22 |
0.14 - 0.27 |
2.5718 times |
Tue 31 December 2024 |
0.21 (40%) |
0.15 |
0.14 - 0.27 |
6.0531 times |
Tue 26 November 2024 |
0.15 (7.14%) |
0.14 |
0.14 - 0.18 |
1.5315 times |
DMA SMA EMA moving averages of Tantech Holdings TANH
DMA (daily moving average) of Tantech Holdings TANH
| DMA period | DMA value | | 5 day DMA | 2.02 | | 12 day DMA | 1.99 | | 20 day DMA | 1.93 | | 35 day DMA | 1.96 | | 50 day DMA | 1.97 | | 100 day DMA | 2.02 | | 150 day DMA | 2.04 | | 200 day DMA | 1.57 | EMA (exponential moving average) of Tantech Holdings TANH
| EMA period | EMA current | EMA prev | EMA prev2 | | 5 day EMA | 2 | 2.02 | 2.02 | | 12 day EMA | 1.99 | 1.99 | 1.99 | | 20 day EMA | 1.97 | 1.97 | 1.97 | | 35 day EMA | 1.97 | 1.97 | 1.97 | | 50 day EMA | 1.97 | 1.97 | 1.97 |
SMA (simple moving average) of Tantech Holdings TANH
| SMA period | SMA current | SMA prev | SMA prev2 | | 5 day SMA | 2.02 | 2.02 | 2.02 | | 12 day SMA | 1.99 | 1.98 | 1.97 | | 20 day SMA | 1.93 | 1.93 | 1.92 | | 35 day SMA | 1.96 | 1.96 | 1.95 | | 50 day SMA | 1.97 | 1.97 | 1.97 | | 100 day SMA | 2.02 | 2.02 | 2.02 | | 150 day SMA | 2.04 | 2.02 | 2.01 | | 200 day SMA | 1.57 | 1.56 | 1.55 |
|
|
