SavaraInc SVRA full analysis,charts,indicators,moving averages,SMA,DMA,EMA,ADX,MACD,RSISavara Inc SVRA WideScreen charts, DMA,SMA,EMA technical analysis, forecast prediction, by indicators ADX,MACD,RSI,CCI NASDAQ stock exchange
operates under Health Care sector & deals in Major Pharmaceuticals
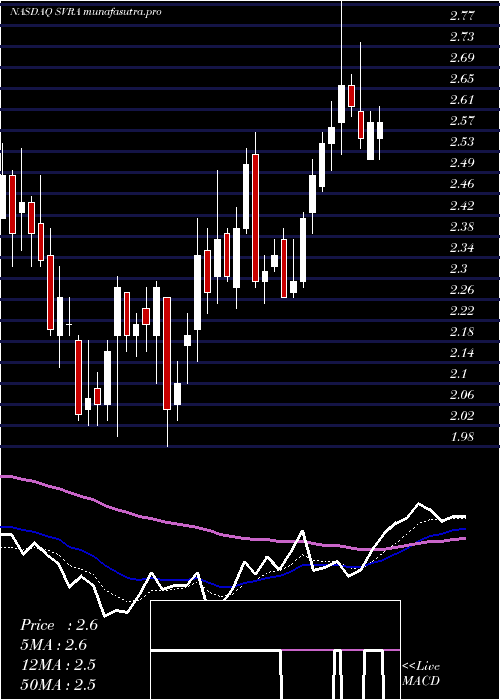
Daily price and charts and targets SavaraInc Strong Daily Stock price targets for SavaraInc SVRA are 6.41 and 6.68 | Daily Target 1 | 6.2 | | Daily Target 2 | 6.35 | | Daily Target 3 | 6.4666666666667 | | Daily Target 4 | 6.62 | | Daily Target 5 | 6.74 |
Daily price and volume Savara Inc
| Date |
Closing |
Open |
Range |
Volume |
Fri 05 December 2025 |
6.51 (2.2%) |
6.38 |
6.31 - 6.58 |
0.8895 times |
Thu 04 December 2025 |
6.37 (1.11%) |
6.24 |
6.15 - 6.45 |
1.1803 times |
Wed 03 December 2025 |
6.30 (8.43%) |
5.85 |
5.82 - 6.61 |
1.2482 times |
Tue 02 December 2025 |
5.81 (-0.51%) |
5.85 |
5.55 - 6.00 |
1.2915 times |
Mon 01 December 2025 |
5.84 (-7.15%) |
5.72 |
5.66 - 6.28 |
1.0748 times |
Fri 28 November 2025 |
6.29 (17.35%) |
5.35 |
5.26 - 6.37 |
1.797 times |
Wed 26 November 2025 |
5.36 (4.08%) |
5.16 |
5.09 - 5.49 |
0.6414 times |
Tue 25 November 2025 |
5.15 (-1.15%) |
5.24 |
5.10 - 5.33 |
0.4514 times |
Mon 24 November 2025 |
5.21 (5.89%) |
4.96 |
4.90 - 5.22 |
0.7675 times |
Fri 21 November 2025 |
4.92 (5.35%) |
4.66 |
4.59 - 4.93 |
0.6584 times |
Thu 20 November 2025 |
4.67 (1.52%) |
4.69 |
4.64 - 4.91 |
0.6734 times |
Weekly price and charts SavaraInc Strong weekly Stock price targets for SavaraInc SVRA are 6.03 and 7.09 | Weekly Target 1 | 5.16 | | Weekly Target 2 | 5.84 | | Weekly Target 3 | 6.2233333333333 | | Weekly Target 4 | 6.9 | | Weekly Target 5 | 7.28 |
Weekly price and volumes for Savara Inc
| Date |
Closing |
Open |
Range |
Volume |
Fri 05 December 2025 |
6.51 (3.5%) |
5.72 |
5.55 - 6.61 |
2.2455 times |
Fri 28 November 2025 |
6.29 (27.85%) |
4.96 |
4.90 - 6.37 |
1.4448 times |
Fri 21 November 2025 |
4.92 (14.42%) |
4.31 |
4.14 - 4.93 |
1.1411 times |
Fri 14 November 2025 |
4.30 (8.86%) |
4.01 |
3.94 - 4.40 |
1.0537 times |
Fri 07 November 2025 |
3.95 (-4.82%) |
4.24 |
3.86 - 4.30 |
0.498 times |
Fri 31 October 2025 |
4.15 (0%) |
4.29 |
4.14 - 4.40 |
0.1405 times |
Fri 31 October 2025 |
4.15 (-4.82%) |
4.37 |
4.14 - 4.51 |
1.1636 times |
Fri 24 October 2025 |
4.36 (19.45%) |
3.67 |
3.60 - 4.42 |
0.8537 times |
Fri 17 October 2025 |
3.65 (8.31%) |
3.37 |
3.35 - 3.75 |
0.8967 times |
Fri 10 October 2025 |
3.37 (-3.44%) |
3.53 |
3.34 - 3.58 |
0.5624 times |
Fri 03 October 2025 |
3.49 (-0.85%) |
3.59 |
3.42 - 3.64 |
0.5343 times |
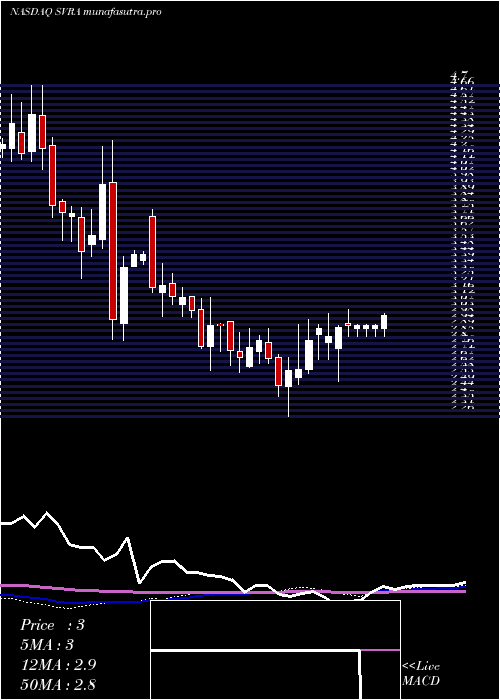
Monthly price and charts SavaraInc Strong monthly Stock price targets for SavaraInc SVRA are 6.03 and 7.09 | Monthly Target 1 | 5.16 | | Monthly Target 2 | 5.84 | | Monthly Target 3 | 6.2233333333333 | | Monthly Target 4 | 6.9 | | Monthly Target 5 | 7.28 |
Monthly price and volumes Savara Inc
| Date |
Closing |
Open |
Range |
Volume |
Fri 05 December 2025 |
6.51 (3.5%) |
5.72 |
5.55 - 6.61 |
0.6986 times |
Fri 28 November 2025 |
6.29 (51.57%) |
4.24 |
3.86 - 6.37 |
1.2871 times |
Fri 31 October 2025 |
4.15 (16.25%) |
3.53 |
3.34 - 4.51 |
1.2075 times |
Tue 30 September 2025 |
3.57 (8.84%) |
3.28 |
3.21 - 3.96 |
1.1358 times |
Fri 29 August 2025 |
3.28 (26.64%) |
2.56 |
2.43 - 3.38 |
0.9429 times |
Thu 31 July 2025 |
2.59 (13.6%) |
2.26 |
1.98 - 2.84 |
0.8904 times |
Mon 30 June 2025 |
2.28 (0%) |
2.39 |
2.00 - 2.55 |
0.7371 times |
Fri 30 May 2025 |
2.28 (-28.75%) |
3.21 |
1.89 - 3.56 |
1.7068 times |
Wed 30 April 2025 |
3.20 (15.52%) |
2.92 |
2.52 - 3.29 |
0.4807 times |
Mon 31 March 2025 |
2.77 (11.24%) |
2.48 |
2.26 - 2.98 |
0.9131 times |
Fri 28 February 2025 |
2.49 (-7.78%) |
2.63 |
2.41 - 2.91 |
0.4459 times |

DMA SMA EMA moving averages of Savara Inc SVRA
DMA (daily moving average) of Savara Inc SVRA
| DMA period | DMA value | | 5 day DMA | 6.17 | | 12 day DMA | 5.59 | | 20 day DMA | 5.02 | | 35 day DMA | 4.65 | | 50 day DMA | 4.3 | | 100 day DMA | 3.69 | | 150 day DMA | 3.3 | | 200 day DMA | 3.18 | EMA (exponential moving average) of Savara Inc SVRA
| EMA period | EMA current | EMA prev | EMA prev2 | | 5 day EMA | 6.2 | 6.04 | 5.88 | | 12 day EMA | 5.68 | 5.53 | 5.38 | | 20 day EMA | 5.3 | 5.17 | 5.04 | | 35 day EMA | 4.81 | 4.71 | 4.61 | | 50 day EMA | 4.42 | 4.33 | 4.25 |
SMA (simple moving average) of Savara Inc SVRA
| SMA period | SMA current | SMA prev | SMA prev2 | | 5 day SMA | 6.17 | 6.12 | 5.92 | | 12 day SMA | 5.59 | 5.39 | 5.21 | | 20 day SMA | 5.02 | 4.89 | 4.77 | | 35 day SMA | 4.65 | 4.57 | 4.49 | | 50 day SMA | 4.3 | 4.24 | 4.18 | | 100 day SMA | 3.69 | 3.65 | 3.61 | | 150 day SMA | 3.3 | 3.28 | 3.26 | | 200 day SMA | 3.18 | 3.16 | 3.14 |
|
|
