SeagateTechnology STX full analysis,charts,indicators,moving averages,SMA,DMA,EMA,ADX,MACD,RSISeagate Technology STX WideScreen charts, DMA,SMA,EMA technical analysis, forecast prediction, by indicators ADX,MACD,RSI,CCI NASDAQ stock exchange
operates under Technology sector & deals in Electronic Components
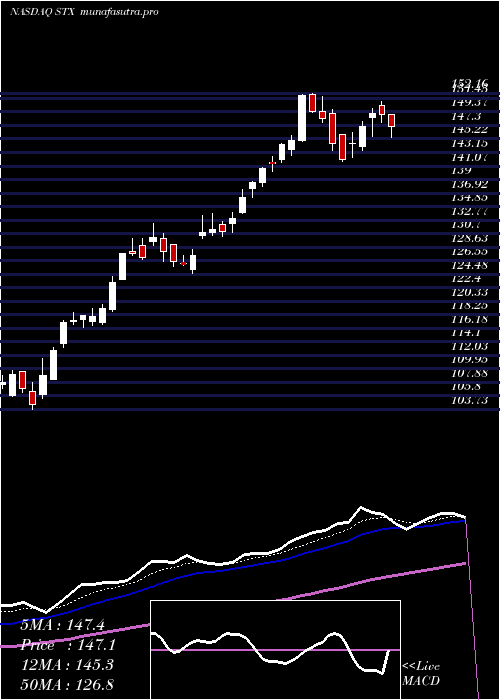
Daily price and charts and targets SeagateTechnology Strong Daily Stock price targets for SeagateTechnology STX are 142.86 and 153.1 | Daily Target 1 | 134.51 | | Daily Target 2 | 140.97 | | Daily Target 3 | 144.75333333333 | | Daily Target 4 | 151.21 | | Daily Target 5 | 154.99 |
Daily price and volume Seagate Technology
| Date |
Closing |
Open |
Range |
Volume |
Wed 30 July 2025 |
147.42 (-3.45%) |
141.00 |
138.30 - 148.54 |
2.7933 times |
Tue 29 July 2025 |
152.68 (1.48%) |
151.75 |
150.00 - 155.52 |
1.4486 times |
Mon 28 July 2025 |
150.46 (-0.28%) |
151.48 |
149.74 - 152.04 |
0.6005 times |
Fri 25 July 2025 |
150.89 (-1.2%) |
152.40 |
148.43 - 153.33 |
0.7261 times |
Thu 24 July 2025 |
152.73 (-0.02%) |
152.23 |
151.08 - 153.88 |
0.5644 times |
Wed 23 July 2025 |
152.76 (4.21%) |
147.15 |
147.00 - 152.83 |
0.9349 times |
Tue 22 July 2025 |
146.59 (-2.03%) |
149.00 |
144.76 - 149.28 |
0.7073 times |
Mon 21 July 2025 |
149.63 (0.38%) |
149.46 |
148.03 - 150.92 |
0.8024 times |
Fri 18 July 2025 |
149.07 (1.67%) |
147.61 |
146.22 - 149.91 |
0.7691 times |
Thu 17 July 2025 |
146.62 (-0.34%) |
147.12 |
146.60 - 149.65 |
0.6535 times |
Wed 16 July 2025 |
147.12 (-1.29%) |
148.98 |
145.51 - 149.00 |
0.6259 times |
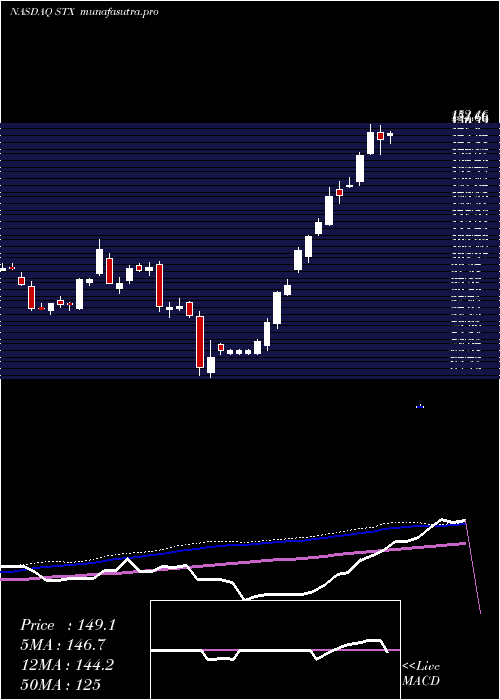
Weekly price and charts SeagateTechnology Strong weekly Stock price targets for SeagateTechnology STX are 134.25 and 151.47 | Weekly Target 1 | 129.86 | | Weekly Target 2 | 138.64 | | Weekly Target 3 | 147.08 | | Weekly Target 4 | 155.86 | | Weekly Target 5 | 164.3 |
Weekly price and volumes for Seagate Technology
| Date |
Closing |
Open |
Range |
Volume |
Wed 30 July 2025 |
147.42 (-2.3%) |
151.48 |
138.30 - 155.52 |
1.1219 times |
Fri 25 July 2025 |
150.89 (1.22%) |
149.46 |
144.76 - 153.88 |
0.8653 times |
Fri 18 July 2025 |
149.07 (1.28%) |
148.55 |
145.51 - 150.96 |
0.7608 times |
Fri 11 July 2025 |
147.18 (-1.51%) |
149.47 |
141.71 - 151.80 |
1.2334 times |
Thu 03 July 2025 |
149.44 (5.66%) |
142.00 |
141.58 - 152.16 |
1.0191 times |
Fri 27 June 2025 |
141.44 (8%) |
132.33 |
130.92 - 142.47 |
1.0933 times |
Fri 20 June 2025 |
130.96 (2.9%) |
130.45 |
130.00 - 133.76 |
0.6595 times |
Fri 13 June 2025 |
127.27 (0.24%) |
129.54 |
124.63 - 132.23 |
1.1896 times |
Fri 06 June 2025 |
126.97 (7.66%) |
117.01 |
116.78 - 129.96 |
1.2294 times |
Fri 30 May 2025 |
117.94 (4.61%) |
113.87 |
113.20 - 119.13 |
0.8277 times |
Fri 23 May 2025 |
112.74 (4.59%) |
105.91 |
103.73 - 113.17 |
1.3739 times |
Monthly price and charts SeagateTechnology Strong monthly Stock price targets for SeagateTechnology STX are 142.86 and 160.08 | Monthly Target 1 | 129.86 | | Monthly Target 2 | 138.64 | | Monthly Target 3 | 147.08 | | Monthly Target 4 | 155.86 | | Monthly Target 5 | 164.3 |
Monthly price and volumes Seagate Technology
| Date |
Closing |
Open |
Range |
Volume |
Wed 30 July 2025 |
147.42 (2.14%) |
143.64 |
138.30 - 155.52 |
1.2744 times |
Mon 30 June 2025 |
144.33 (22.38%) |
117.01 |
116.78 - 144.48 |
1.1591 times |
Fri 30 May 2025 |
117.94 (29.56%) |
92.00 |
89.89 - 119.13 |
1.2332 times |
Wed 30 April 2025 |
91.03 (7.16%) |
84.60 |
63.19 - 91.51 |
1.5657 times |
Mon 31 March 2025 |
84.95 (-16.64%) |
102.95 |
82.88 - 103.87 |
0.8988 times |
Fri 28 February 2025 |
101.91 (5.76%) |
94.60 |
92.68 - 103.84 |
0.7466 times |
Fri 31 January 2025 |
96.36 (11.64%) |
87.21 |
85.79 - 111.91 |
1.1894 times |
Tue 31 December 2024 |
86.31 (-15.1%) |
98.43 |
85.25 - 100.18 |
0.6062 times |
Tue 26 November 2024 |
101.66 (1.29%) |
99.59 |
96.10 - 106.24 |
0.5505 times |
Thu 31 October 2024 |
100.37 (-8.36%) |
109.27 |
98.91 - 115.32 |
0.776 times |
Mon 30 September 2024 |
109.53 (10.03%) |
99.55 |
94.70 - 110.93 |
0.6085 times |
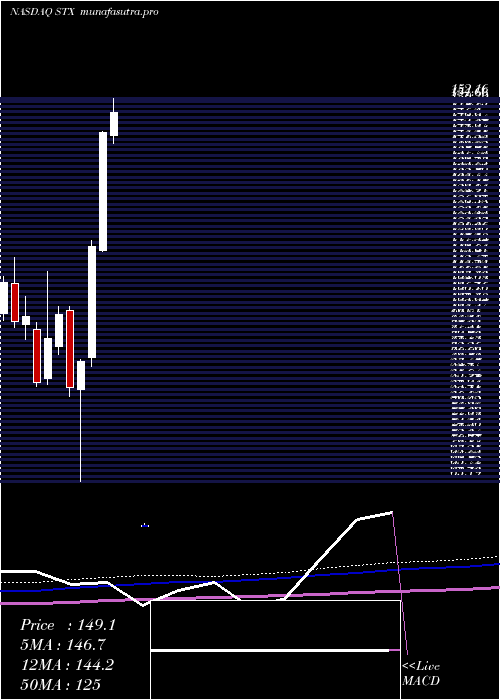
DMA SMA EMA moving averages of Seagate Technology STX
DMA (daily moving average) of Seagate Technology STX
| DMA period | DMA value | | 5 day DMA | 150.84 | | 12 day DMA | 149.59 | | 20 day DMA | 148.6 | | 35 day DMA | 142.36 | | 50 day DMA | 134.55 | | 100 day DMA | 109.3 | | 150 day DMA | 104.91 | | 200 day DMA | 104.11 | EMA (exponential moving average) of Seagate Technology STX
| EMA period | EMA current | EMA prev | EMA prev2 | | 5 day EMA | 150 | 151.29 | 150.59 | | 12 day EMA | 149.23 | 149.56 | 148.99 | | 20 day EMA | 146.89 | 146.83 | 146.22 | | 35 day EMA | 140.41 | 140 | 139.25 | | 50 day EMA | 133.57 | 133.01 | 132.21 |
SMA (simple moving average) of Seagate Technology STX
| SMA period | SMA current | SMA prev | SMA prev2 | | 5 day SMA | 150.84 | 151.9 | 150.69 | | 12 day SMA | 149.59 | 149.72 | 149.27 | | 20 day SMA | 148.6 | 148.48 | 148.07 | | 35 day SMA | 142.36 | 141.78 | 141.06 | | 50 day SMA | 134.55 | 133.75 | 132.8 | | 100 day SMA | 109.3 | 108.7 | 108.09 | | 150 day SMA | 104.91 | 104.51 | 104.08 | | 200 day SMA | 104.11 | 103.91 | 103.69 |
|
|
