SunpowerCorporation SPWR full analysis,charts,indicators,moving averages,SMA,DMA,EMA,ADX,MACD,RSISunpower Corporation SPWR WideScreen charts, DMA,SMA,EMA technical analysis, forecast prediction, by indicators ADX,MACD,RSI,CCI NASDAQ stock exchange
operates under Technology sector & deals in Semiconductors
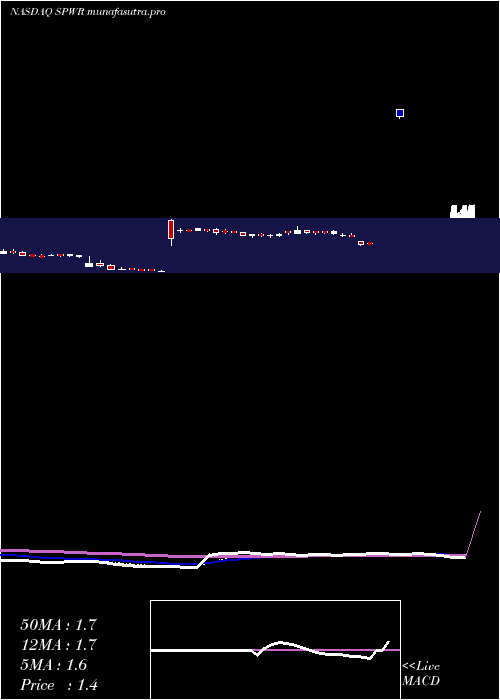
Daily price and charts and targets SunpowerCorporation Strong Daily Stock price targets for SunpowerCorporation SPWR are 1.96 and 2.27 | Daily Target 1 | 1.7 | | Daily Target 2 | 1.9 | | Daily Target 3 | 2.01 | | Daily Target 4 | 2.21 | | Daily Target 5 | 2.32 |
Daily price and volume Sunpower Corporation
| Date |
Closing |
Open |
Range |
Volume |
Thu 23 October 2025 |
2.10 (11.7%) |
1.91 |
1.81 - 2.12 |
0.4431 times |
Wed 22 October 2025 |
1.88 (-6%) |
1.89 |
1.80 - 2.00 |
0.5383 times |
Tue 21 October 2025 |
2.00 (14.29%) |
2.26 |
1.80 - 2.27 |
6.9066 times |
Mon 20 October 2025 |
1.75 (0.57%) |
1.76 |
1.72 - 1.80 |
0.3417 times |
Fri 17 October 2025 |
1.74 (-5.95%) |
1.85 |
1.67 - 1.86 |
0.2631 times |
Thu 16 October 2025 |
1.85 (-6.57%) |
2.04 |
1.80 - 2.04 |
0.4148 times |
Wed 15 October 2025 |
1.98 (17.86%) |
1.69 |
1.69 - 2.00 |
0.5104 times |
Tue 14 October 2025 |
1.68 (1.2%) |
1.61 |
1.59 - 1.70 |
0.121 times |
Mon 13 October 2025 |
1.66 (3.75%) |
1.65 |
1.65 - 1.75 |
0.1248 times |
Fri 10 October 2025 |
1.60 (-8.57%) |
1.76 |
1.56 - 1.78 |
0.3363 times |
Thu 09 October 2025 |
1.75 (-2.23%) |
1.82 |
1.72 - 1.84 |
0.3075 times |
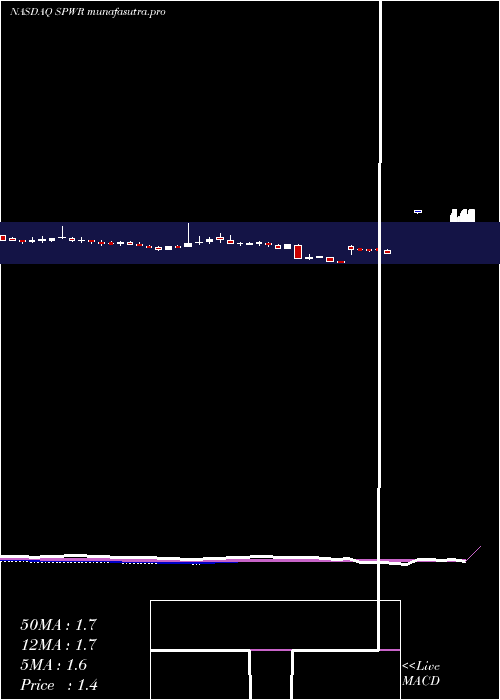
Weekly price and charts SunpowerCorporation Strong weekly Stock price targets for SunpowerCorporation SPWR are 1.91 and 2.46 | Weekly Target 1 | 1.48 | | Weekly Target 2 | 1.79 | | Weekly Target 3 | 2.03 | | Weekly Target 4 | 2.34 | | Weekly Target 5 | 2.58 |
Weekly price and volumes for Sunpower Corporation
| Date |
Closing |
Open |
Range |
Volume |
Thu 23 October 2025 |
2.10 (20.69%) |
1.76 |
1.72 - 2.27 |
5.3157 times |
Fri 17 October 2025 |
1.74 (8.75%) |
1.65 |
1.59 - 2.04 |
0.9263 times |
Fri 10 October 2025 |
1.60 (-20.79%) |
2.07 |
1.56 - 2.12 |
0.8585 times |
Fri 03 October 2025 |
2.02 (14.12%) |
1.79 |
1.66 - 2.16 |
0.9654 times |
Fri 26 September 2025 |
1.77 (12.03%) |
1.61 |
1.60 - 2.01 |
0.9892 times |
Fri 19 September 2025 |
1.58 (2.6%) |
1.52 |
1.52 - 1.68 |
0.271 times |
Fri 12 September 2025 |
1.54 (2.67%) |
1.57 |
1.47 - 1.58 |
0.184 times |
Fri 05 September 2025 |
1.50 (-0.66%) |
1.51 |
1.44 - 1.57 |
0.2265 times |
Fri 29 August 2025 |
1.51 (0%) |
1.53 |
1.47 - 1.54 |
0.037 times |
Fri 29 August 2025 |
1.51 (-8.48%) |
1.62 |
1.47 - 1.66 |
0.2264 times |
Fri 22 August 2025 |
1.65 (-0.6%) |
1.80 |
1.58 - 1.85 |
0.3825 times |
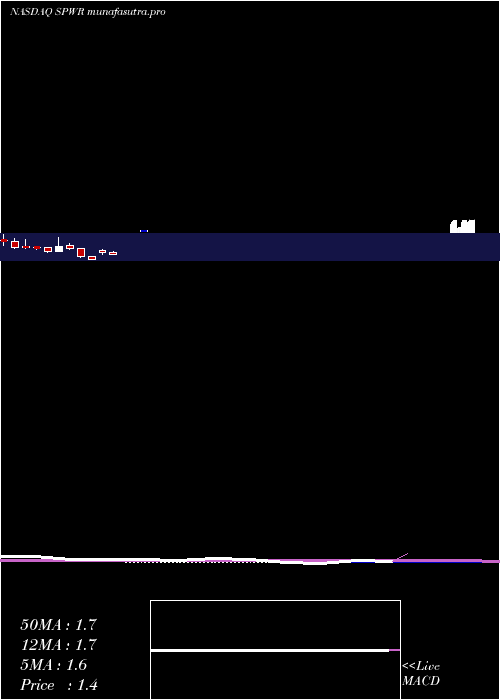
Monthly price and charts SunpowerCorporation Strong monthly Stock price targets for SunpowerCorporation SPWR are 1.83 and 2.54 | Monthly Target 1 | 1.27 | | Monthly Target 2 | 1.68 | | Monthly Target 3 | 1.9766666666667 | | Monthly Target 4 | 2.39 | | Monthly Target 5 | 2.69 |
Monthly price and volumes Sunpower Corporation
| Date |
Closing |
Open |
Range |
Volume |
Thu 23 October 2025 |
2.10 (19.32%) |
1.78 |
1.56 - 2.27 |
0.5737 times |
Tue 30 September 2025 |
1.76 (16.56%) |
1.51 |
1.44 - 2.01 |
0.1408 times |
Fri 29 August 2025 |
1.51 (-3.82%) |
1.57 |
1.40 - 1.85 |
0.0954 times |
Thu 31 July 2025 |
1.57 (-14.67%) |
1.82 |
1.51 - 2.15 |
0.1652 times |
Mon 30 June 2025 |
1.84 (32.37%) |
1.39 |
1.34 - 2.05 |
0.2458 times |
Fri 30 May 2025 |
1.39 (-26.46%) |
1.95 |
1.19 - 2.16 |
0.1394 times |
Wed 30 April 2025 |
1.89 (1475%) |
2.42 |
1.27 - 2.50 |
0.0219 times |
Thu 15 August 2024 |
0.12 (-85.88%) |
0.88 |
0.09 - 0.89 |
2.6194 times |
Wed 31 July 2024 |
0.85 (-71.28%) |
2.87 |
0.50 - 2.95 |
4.6269 times |
Fri 28 June 2024 |
2.96 (-11.38%) |
3.66 |
2.51 - 4.25 |
1.3716 times |
Fri 31 May 2024 |
3.34 (62.14%) |
2.10 |
2.05 - 5.63 |
2.8237 times |
DMA SMA EMA moving averages of Sunpower Corporation SPWR
DMA (daily moving average) of Sunpower Corporation SPWR
| DMA period | DMA value | | 5 day DMA | 1.89 | | 12 day DMA | 1.82 | | 20 day DMA | 1.84 | | 35 day DMA | 1.73 | | 50 day DMA | 1.69 | | 100 day DMA | 1.71 | | 150 day DMA | 1.58 | | 200 day DMA | 1.9 | EMA (exponential moving average) of Sunpower Corporation SPWR
| EMA period | EMA current | EMA prev | EMA prev2 | | 5 day EMA | 1.94 | 1.86 | 1.85 | | 12 day EMA | 1.86 | 1.82 | 1.81 | | 20 day EMA | 1.82 | 1.79 | 1.78 | | 35 day EMA | 1.77 | 1.75 | 1.74 | | 50 day EMA | 1.69 | 1.67 | 1.66 |
SMA (simple moving average) of Sunpower Corporation SPWR
| SMA period | SMA current | SMA prev | SMA prev2 | | 5 day SMA | 1.89 | 1.84 | 1.86 | | 12 day SMA | 1.82 | 1.8 | 1.81 | | 20 day SMA | 1.84 | 1.81 | 1.81 | | 35 day SMA | 1.73 | 1.71 | 1.7 | | 50 day SMA | 1.69 | 1.68 | 1.67 | | 100 day SMA | 1.71 | 1.7 | 1.7 | | 150 day SMA | 1.58 | 1.58 | 1.59 | | 200 day SMA | 1.9 | 1.9 | 1.9 |
|
|
