SundialGrowers SNDL full analysis,charts,indicators,moving averages,SMA,DMA,EMA,ADX,MACD,RSISundial Growers SNDL WideScreen charts, DMA,SMA,EMA technical analysis, forecast prediction, by indicators ADX,MACD,RSI,CCI NASDAQ stock exchange
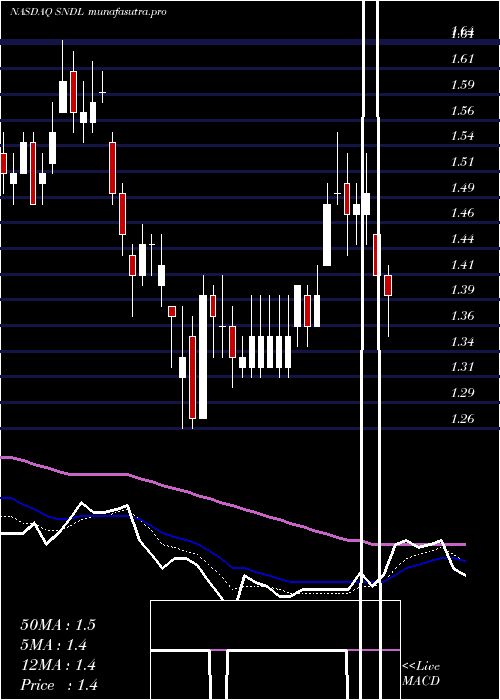
Daily price and charts and targets SundialGrowers Strong Daily Stock price targets for SundialGrowers SNDL are 1.66 and 1.73 | Daily Target 1 | 1.65 | | Daily Target 2 | 1.67 | | Daily Target 3 | 1.7166666666667 | | Daily Target 4 | 1.74 | | Daily Target 5 | 1.79 |
Daily price and volume Sundial Growers
| Date |
Closing |
Open |
Range |
Volume |
Fri 05 December 2025 |
1.70 (-2.86%) |
1.74 |
1.69 - 1.76 |
1.152 times |
Thu 04 December 2025 |
1.75 (0.57%) |
1.74 |
1.70 - 1.77 |
0.6521 times |
Wed 03 December 2025 |
1.74 (1.75%) |
1.70 |
1.69 - 1.76 |
0.5917 times |
Tue 02 December 2025 |
1.71 (1.79%) |
1.68 |
1.64 - 1.75 |
0.9441 times |
Mon 01 December 2025 |
1.68 (-4.55%) |
1.74 |
1.67 - 1.74 |
0.9392 times |
Fri 28 November 2025 |
1.76 (1.15%) |
1.72 |
1.71 - 1.78 |
0.6193 times |
Wed 26 November 2025 |
1.74 (-0.57%) |
1.74 |
1.72 - 1.78 |
0.8604 times |
Tue 25 November 2025 |
1.75 (-1.69%) |
1.77 |
1.71 - 1.77 |
0.6561 times |
Mon 24 November 2025 |
1.78 (10.56%) |
1.67 |
1.64 - 1.79 |
1.5267 times |
Fri 21 November 2025 |
1.61 (1.26%) |
1.59 |
1.57 - 1.63 |
2.0584 times |
Thu 20 November 2025 |
1.59 (-1.85%) |
1.63 |
1.59 - 1.67 |
1.0826 times |
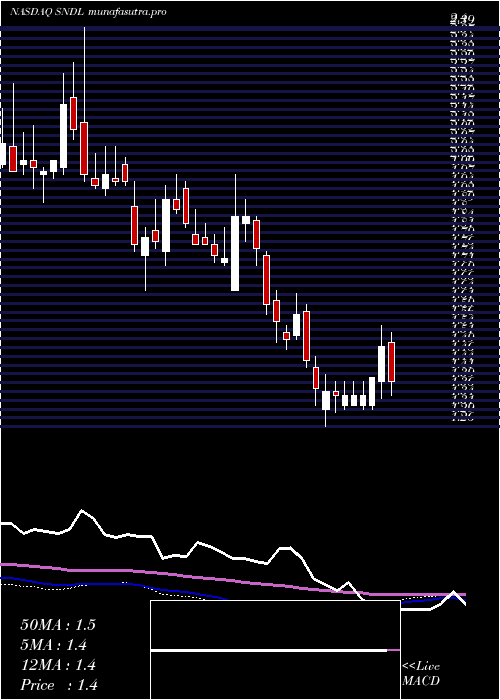
Weekly price and charts SundialGrowers Strong weekly Stock price targets for SundialGrowers SNDL are 1.61 and 1.74 | Weekly Target 1 | 1.57 | | Weekly Target 2 | 1.64 | | Weekly Target 3 | 1.7033333333333 | | Weekly Target 4 | 1.77 | | Weekly Target 5 | 1.83 |
Weekly price and volumes for Sundial Growers
| Date |
Closing |
Open |
Range |
Volume |
Fri 05 December 2025 |
1.70 (-3.41%) |
1.74 |
1.64 - 1.77 |
0.5254 times |
Fri 28 November 2025 |
1.76 (9.32%) |
1.67 |
1.64 - 1.79 |
0.4497 times |
Fri 21 November 2025 |
1.61 (-4.17%) |
1.66 |
1.57 - 1.71 |
1.1184 times |
Fri 14 November 2025 |
1.68 (-5.62%) |
1.80 |
1.66 - 1.90 |
0.8805 times |
Fri 07 November 2025 |
1.78 (-17.21%) |
1.90 |
1.68 - 1.99 |
1.0466 times |
Fri 31 October 2025 |
2.15 (0%) |
2.14 |
2.13 - 2.19 |
0.0946 times |
Fri 31 October 2025 |
2.15 (-4.02%) |
2.27 |
2.13 - 2.29 |
0.6787 times |
Fri 24 October 2025 |
2.24 (-3.86%) |
2.34 |
2.15 - 2.40 |
0.7744 times |
Fri 17 October 2025 |
2.33 (-7.54%) |
2.59 |
2.30 - 2.60 |
1.8015 times |
Fri 10 October 2025 |
2.52 (-2.33%) |
2.61 |
2.51 - 2.89 |
2.63 times |
Fri 03 October 2025 |
2.58 (10.73%) |
2.53 |
2.48 - 2.79 |
1.8555 times |
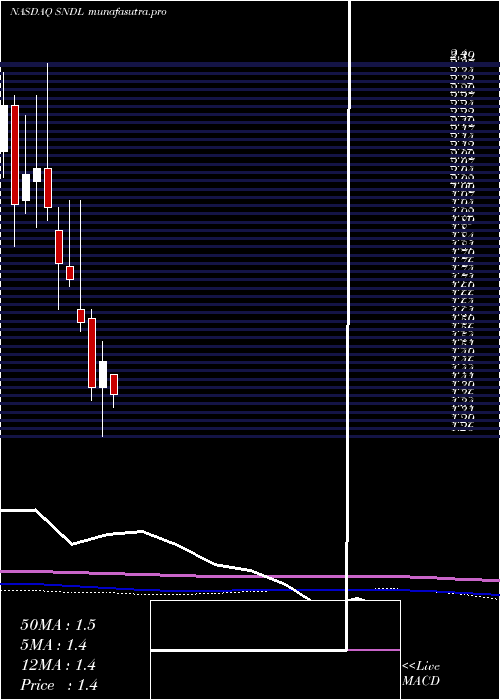
Monthly price and charts SundialGrowers Strong monthly Stock price targets for SundialGrowers SNDL are 1.61 and 1.74 | Monthly Target 1 | 1.57 | | Monthly Target 2 | 1.64 | | Monthly Target 3 | 1.7033333333333 | | Monthly Target 4 | 1.77 | | Monthly Target 5 | 1.83 |
Monthly price and volumes Sundial Growers
| Date |
Closing |
Open |
Range |
Volume |
Fri 05 December 2025 |
1.70 (-3.41%) |
1.74 |
1.64 - 1.77 |
0.1286 times |
Fri 28 November 2025 |
1.76 (-18.14%) |
1.90 |
1.57 - 1.99 |
0.8553 times |
Fri 31 October 2025 |
2.15 (-19.78%) |
2.64 |
2.13 - 2.89 |
1.643 times |
Tue 30 September 2025 |
2.68 (0%) |
2.56 |
2.32 - 2.79 |
1.4571 times |
Fri 29 August 2025 |
2.68 (55.81%) |
1.70 |
1.62 - 2.74 |
2.1619 times |
Thu 31 July 2025 |
1.72 (42.15%) |
1.20 |
1.15 - 1.84 |
1.2801 times |
Mon 30 June 2025 |
1.21 (-4.72%) |
1.27 |
1.20 - 1.37 |
0.5183 times |
Fri 30 May 2025 |
1.27 (-14.77%) |
1.45 |
1.24 - 1.45 |
0.7313 times |
Wed 30 April 2025 |
1.49 (5.67%) |
1.41 |
1.26 - 1.55 |
0.5873 times |
Mon 31 March 2025 |
1.41 (-12.42%) |
1.62 |
1.37 - 1.65 |
0.6372 times |
Fri 28 February 2025 |
1.61 (-7.47%) |
1.65 |
1.58 - 1.98 |
0.8683 times |
DMA SMA EMA moving averages of Sundial Growers SNDL
DMA (daily moving average) of Sundial Growers SNDL
| DMA period | DMA value | | 5 day DMA | 1.72 | | 12 day DMA | 1.7 | | 20 day DMA | 1.72 | | 35 day DMA | 1.9 | | 50 day DMA | 2.1 | | 100 day DMA | 2.12 | | 150 day DMA | 1.85 | | 200 day DMA | 1.76 | EMA (exponential moving average) of Sundial Growers SNDL
| EMA period | EMA current | EMA prev | EMA prev2 | | 5 day EMA | 1.72 | 1.73 | 1.72 | | 12 day EMA | 1.73 | 1.74 | 1.74 | | 20 day EMA | 1.78 | 1.79 | 1.79 | | 35 day EMA | 1.92 | 1.93 | 1.94 | | 50 day EMA | 2.09 | 2.11 | 2.12 |
SMA (simple moving average) of Sundial Growers SNDL
| SMA period | SMA current | SMA prev | SMA prev2 | | 5 day SMA | 1.72 | 1.73 | 1.73 | | 12 day SMA | 1.7 | 1.7 | 1.7 | | 20 day SMA | 1.72 | 1.73 | 1.73 | | 35 day SMA | 1.9 | 1.92 | 1.94 | | 50 day SMA | 2.1 | 2.12 | 2.13 | | 100 day SMA | 2.12 | 2.11 | 2.11 | | 150 day SMA | 1.85 | 1.85 | 1.84 | | 200 day SMA | 1.76 | 1.76 | 1.76 |
|
|
