SemiconductorVaneck SMH full analysis,charts,indicators,moving averages,SMA,DMA,EMA,ADX,MACD,RSISemiconductor Vaneck SMH WideScreen charts, DMA,SMA,EMA technical analysis, forecast prediction, by indicators ADX,MACD,RSI,CCI NASDAQ stock exchange
Daily price and charts and targets SemiconductorVaneck Strong Daily Stock price targets for SemiconductorVaneck SMH are 281.14 and 285.92 | Daily Target 1 | 279.75 | | Daily Target 2 | 282.53 | | Daily Target 3 | 284.52666666667 | | Daily Target 4 | 287.31 | | Daily Target 5 | 289.31 |
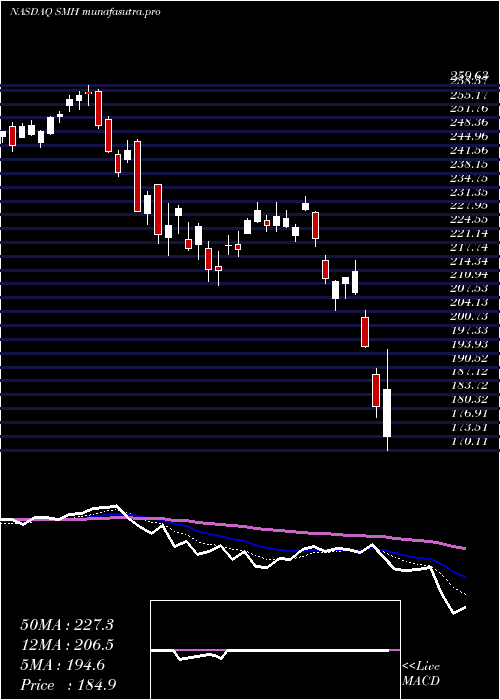
Daily price and volume Semiconductor Vaneck
| Date |
Closing |
Open |
Range |
Volume |
Mon 14 July 2025 |
285.32 (-0.75%) |
286.30 |
281.74 - 286.52 |
1.0524 times |
Fri 11 July 2025 |
287.49 (-0.01%) |
286.47 |
285.55 - 288.94 |
0.8013 times |
Thu 10 July 2025 |
287.52 (0.74%) |
287.89 |
284.56 - 288.19 |
0.7956 times |
Wed 09 July 2025 |
285.42 (0.68%) |
284.73 |
283.57 - 287.84 |
0.9612 times |
Tue 08 July 2025 |
283.48 (1.33%) |
281.61 |
280.70 - 284.73 |
1.1556 times |
Mon 07 July 2025 |
279.76 (-1.36%) |
281.76 |
278.55 - 282.64 |
1.2163 times |
Thu 03 July 2025 |
283.62 (0.84%) |
282.82 |
282.31 - 285.19 |
0.6272 times |
Wed 02 July 2025 |
281.25 (1.96%) |
274.82 |
274.66 - 281.92 |
1.2299 times |
Tue 01 July 2025 |
275.84 (-1.09%) |
276.80 |
272.16 - 278.05 |
1.2607 times |
Mon 30 June 2025 |
278.88 (0.17%) |
279.70 |
277.10 - 279.96 |
0.8997 times |
Fri 27 June 2025 |
278.42 (0.44%) |
278.18 |
275.64 - 280.50 |
1.1534 times |
Weekly price and charts SemiconductorVaneck Strong weekly Stock price targets for SemiconductorVaneck SMH are 281.14 and 285.92 | Weekly Target 1 | 279.75 | | Weekly Target 2 | 282.53 | | Weekly Target 3 | 284.52666666667 | | Weekly Target 4 | 287.31 | | Weekly Target 5 | 289.31 |
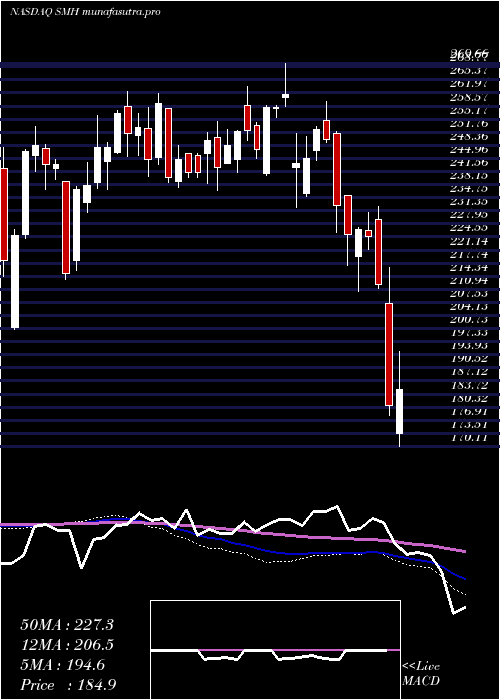
Weekly price and volumes for Semiconductor Vaneck
| Date |
Closing |
Open |
Range |
Volume |
Mon 14 July 2025 |
285.32 (-0.75%) |
286.30 |
281.74 - 286.52 |
0.2291 times |
Fri 11 July 2025 |
287.49 (1.36%) |
281.76 |
278.55 - 288.94 |
1.0732 times |
Thu 03 July 2025 |
283.62 (1.87%) |
279.70 |
272.16 - 285.19 |
0.8745 times |
Fri 27 June 2025 |
278.42 (6.97%) |
259.85 |
257.12 - 280.50 |
1.3179 times |
Fri 20 June 2025 |
260.27 (1.28%) |
262.44 |
257.22 - 265.53 |
0.8017 times |
Fri 13 June 2025 |
256.99 (1.69%) |
255.00 |
255.00 - 264.91 |
1.586 times |
Fri 06 June 2025 |
252.73 (5.41%) |
239.18 |
238.96 - 256.06 |
1.0185 times |
Fri 30 May 2025 |
239.75 (0.97%) |
242.49 |
235.37 - 249.21 |
1.2228 times |
Fri 23 May 2025 |
237.44 (-3.64%) |
241.40 |
234.59 - 248.58 |
0.7825 times |
Fri 16 May 2025 |
246.42 (10.3%) |
236.72 |
234.05 - 249.44 |
1.0939 times |
Fri 09 May 2025 |
223.40 (2%) |
217.03 |
212.84 - 225.36 |
0.8617 times |
Monthly price and charts SemiconductorVaneck Strong monthly Stock price targets for SemiconductorVaneck SMH are 278.74 and 295.52 | Monthly Target 1 | 265.36 | | Monthly Target 2 | 275.34 | | Monthly Target 3 | 282.14 | | Monthly Target 4 | 292.12 | | Monthly Target 5 | 298.92 |
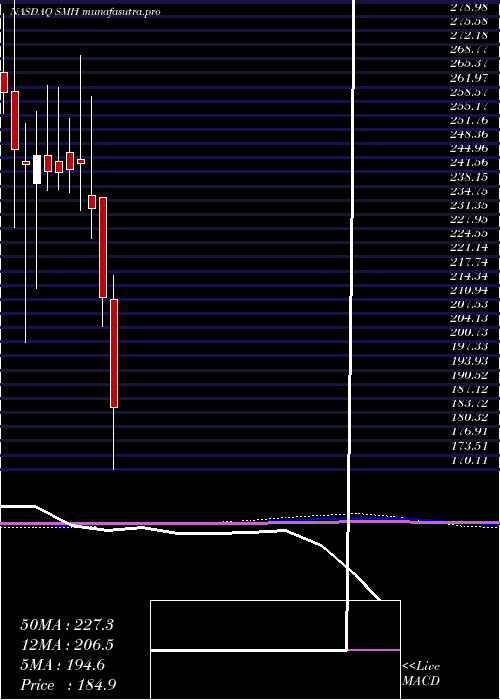
Monthly price and volumes Semiconductor Vaneck
| Date |
Closing |
Open |
Range |
Volume |
Mon 14 July 2025 |
285.32 (2.31%) |
276.80 |
272.16 - 288.94 |
0.4882 times |
Mon 30 June 2025 |
278.88 (16.32%) |
239.18 |
238.96 - 280.50 |
1.2126 times |
Fri 30 May 2025 |
239.75 (13.48%) |
214.93 |
212.11 - 249.44 |
1.0777 times |
Wed 30 April 2025 |
211.28 (-0.09%) |
210.96 |
170.11 - 216.61 |
1.6891 times |
Mon 31 March 2025 |
211.47 (-9.15%) |
235.37 |
204.51 - 235.37 |
1.0851 times |
Fri 28 February 2025 |
232.77 (-4.45%) |
235.97 |
225.63 - 259.63 |
0.8463 times |
Fri 31 January 2025 |
243.62 (0.6%) |
244.52 |
232.24 - 269.66 |
1.1781 times |
Tue 31 December 2024 |
242.17 (0.31%) |
246.22 |
236.54 - 254.47 |
0.5974 times |
Tue 26 November 2024 |
241.42 (-0.11%) |
244.19 |
237.39 - 261.88 |
0.8591 times |
Thu 31 October 2024 |
241.68 (-1.54%) |
245.63 |
237.00 - 262.26 |
0.9665 times |
Mon 30 September 2024 |
245.45 (0.82%) |
238.87 |
213.57 - 255.99 |
1.1926 times |
DMA SMA EMA moving averages of Semiconductor Vaneck SMH
DMA (daily moving average) of Semiconductor Vaneck SMH
| DMA period | DMA value | | 5 day DMA | 285.85 | | 12 day DMA | 282.02 | | 20 day DMA | 274.87 | | 35 day DMA | 263.35 | | 50 day DMA | 253.49 | | 100 day DMA | 235.41 | | 150 day DMA | 239.74 | | 200 day DMA | 241.71 | EMA (exponential moving average) of Semiconductor Vaneck SMH
| EMA period | EMA current | EMA prev | EMA prev2 | | 5 day EMA | 285.26 | 285.23 | 284.1 | | 12 day EMA | 280.92 | 280.12 | 278.78 | | 20 day EMA | 275.05 | 273.97 | 272.55 | | 35 day EMA | 264.04 | 262.79 | 261.34 | | 50 day EMA | 252.89 | 251.57 | 250.1 |
SMA (simple moving average) of Semiconductor Vaneck SMH
| SMA period | SMA current | SMA prev | SMA prev2 | | 5 day SMA | 285.85 | 284.73 | 283.96 | | 12 day SMA | 282.02 | 281.17 | 279.84 | | 20 day SMA | 274.87 | 273.7 | 272.43 | | 35 day SMA | 263.35 | 262.21 | 261.02 | | 50 day SMA | 253.49 | 251.99 | 250.45 | | 100 day SMA | 235.41 | 235.08 | 234.69 | | 150 day SMA | 239.74 | 239.47 | 239.19 | | 200 day SMA | 241.71 | 241.47 | 241.2 |
|
|
