SuperMicro SMCI full analysis,charts,indicators,moving averages,SMA,DMA,EMA,ADX,MACD,RSISuper Micro SMCI WideScreen charts, DMA,SMA,EMA technical analysis, forecast prediction, by indicators ADX,MACD,RSI,CCI NASDAQ stock exchange
operates under Technology sector & deals in Computer Manufacturing
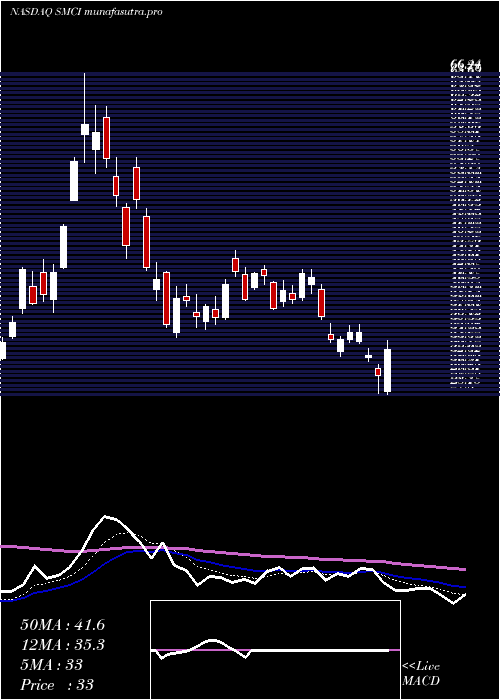
Daily price and charts and targets SuperMicro Strong Daily Stock price targets for SuperMicro SMCI are 33.67 and 35 | Daily Target 1 | 32.58 | | Daily Target 2 | 33.42 | | Daily Target 3 | 33.913333333333 | | Daily Target 4 | 34.75 | | Daily Target 5 | 35.24 |
Daily price and volume Super Micro
| Date |
Closing |
Open |
Range |
Volume |
Thu 04 December 2025 |
34.25 (1.69%) |
33.74 |
33.08 - 34.41 |
0.7066 times |
Wed 03 December 2025 |
33.68 (2.37%) |
33.00 |
32.67 - 33.71 |
0.8617 times |
Tue 02 December 2025 |
32.90 (-1.53%) |
33.56 |
32.89 - 34.33 |
0.7543 times |
Mon 01 December 2025 |
33.41 (-1.3%) |
33.37 |
32.57 - 33.95 |
1.1097 times |
Fri 28 November 2025 |
33.85 (3.2%) |
33.33 |
32.88 - 33.86 |
0.5702 times |
Wed 26 November 2025 |
32.80 (0.92%) |
33.20 |
32.31 - 33.42 |
0.8003 times |
Tue 25 November 2025 |
32.50 (-2.49%) |
33.18 |
31.17 - 33.29 |
0.8659 times |
Mon 24 November 2025 |
33.33 (3.54%) |
33.28 |
31.98 - 33.54 |
0.8283 times |
Fri 21 November 2025 |
32.19 (2%) |
32.14 |
31.03 - 32.57 |
1.4989 times |
Thu 20 November 2025 |
31.56 (-6.43%) |
35.53 |
31.45 - 35.54 |
2.0041 times |
Wed 19 November 2025 |
33.73 (-3.38%) |
34.55 |
33.20 - 34.97 |
1.5318 times |
Weekly price and charts SuperMicro Strong weekly Stock price targets for SuperMicro SMCI are 33.41 and 35.25 | Weekly Target 1 | 31.9 | | Weekly Target 2 | 33.08 | | Weekly Target 3 | 33.743333333333 | | Weekly Target 4 | 34.92 | | Weekly Target 5 | 35.58 |
Weekly price and volumes for Super Micro
| Date |
Closing |
Open |
Range |
Volume |
Thu 04 December 2025 |
34.25 (1.18%) |
33.37 |
32.57 - 34.41 |
0.5886 times |
Fri 28 November 2025 |
33.85 (5.16%) |
33.28 |
31.17 - 33.86 |
0.5255 times |
Fri 21 November 2025 |
32.19 (-11.61%) |
35.58 |
31.03 - 35.82 |
1.3496 times |
Fri 14 November 2025 |
36.42 (-8.47%) |
41.46 |
33.69 - 41.63 |
1.1912 times |
Fri 07 November 2025 |
39.79 (-23.42%) |
48.63 |
38.14 - 49.43 |
1.1279 times |
Fri 31 October 2025 |
51.96 (0%) |
51.39 |
50.80 - 52.99 |
0.1802 times |
Fri 31 October 2025 |
51.96 (7.64%) |
49.72 |
49.72 - 54.08 |
1.0732 times |
Fri 24 October 2025 |
48.27 (-7.88%) |
52.92 |
46.92 - 56.60 |
1.3275 times |
Fri 17 October 2025 |
52.40 (-0.87%) |
54.81 |
51.05 - 56.23 |
0.9021 times |
Fri 10 October 2025 |
52.86 (2.14%) |
52.09 |
51.97 - 58.78 |
1.7343 times |
Fri 03 October 2025 |
51.75 (12.94%) |
46.28 |
45.94 - 53.51 |
1.445 times |
Monthly price and charts SuperMicro Strong monthly Stock price targets for SuperMicro SMCI are 33.41 and 35.25 | Monthly Target 1 | 31.9 | | Monthly Target 2 | 33.08 | | Monthly Target 3 | 33.743333333333 | | Monthly Target 4 | 34.92 | | Monthly Target 5 | 35.58 |
Monthly price and volumes Super Micro
| Date |
Closing |
Open |
Range |
Volume |
Thu 04 December 2025 |
34.25 (1.18%) |
33.37 |
32.57 - 34.41 |
0.0868 times |
Fri 28 November 2025 |
33.85 (-34.85%) |
48.63 |
31.03 - 49.43 |
0.6185 times |
Fri 31 October 2025 |
51.96 (8.39%) |
47.57 |
46.92 - 58.78 |
0.9058 times |
Tue 30 September 2025 |
47.94 (15.41%) |
40.03 |
39.56 - 48.53 |
0.7624 times |
Fri 29 August 2025 |
41.54 (-29.56%) |
57.11 |
41.31 - 59.40 |
0.9501 times |
Thu 31 July 2025 |
58.97 (20.32%) |
48.24 |
46.22 - 62.36 |
1.1005 times |
Mon 30 June 2025 |
49.01 (22.46%) |
39.65 |
39.51 - 50.55 |
1.0874 times |
Fri 30 May 2025 |
40.02 (25.61%) |
32.15 |
30.54 - 47.80 |
1.5787 times |
Wed 30 April 2025 |
31.86 (-6.95%) |
34.25 |
27.60 - 37.82 |
1.187 times |
Mon 31 March 2025 |
34.24 (-17.41%) |
42.28 |
32.14 - 44.99 |
1.7227 times |
Fri 28 February 2025 |
41.46 (45.37%) |
27.20 |
25.71 - 66.44 |
3.1855 times |
DMA SMA EMA moving averages of Super Micro SMCI
DMA (daily moving average) of Super Micro SMCI
| DMA period | DMA value | | 5 day DMA | 33.62 | | 12 day DMA | 33.26 | | 20 day DMA | 35.09 | | 35 day DMA | 41.9 | | 50 day DMA | 45.01 | | 100 day DMA | 46.1 | | 150 day DMA | 44.99 | | 200 day DMA | 43.3 | EMA (exponential moving average) of Super Micro SMCI
| EMA period | EMA current | EMA prev | EMA prev2 | | 5 day EMA | 33.65 | 33.35 | 33.18 | | 12 day EMA | 34.33 | 34.35 | 34.47 | | 20 day EMA | 36.28 | 36.49 | 36.79 | | 35 day EMA | 39.67 | 39.99 | 40.36 | | 50 day EMA | 43.97 | 44.37 | 44.81 |
SMA (simple moving average) of Super Micro SMCI
| SMA period | SMA current | SMA prev | SMA prev2 | | 5 day SMA | 33.62 | 33.33 | 33.09 | | 12 day SMA | 33.26 | 33.25 | 33.48 | | 20 day SMA | 35.09 | 35.48 | 36.17 | | 35 day SMA | 41.9 | 42.46 | 43.02 | | 50 day SMA | 45.01 | 45.25 | 45.51 | | 100 day SMA | 46.1 | 46.29 | 46.45 | | 150 day SMA | 44.99 | 44.97 | 44.99 | | 200 day SMA | 43.3 | 43.41 | 43.48 |
|
|
