SellasLife SLS full analysis,charts,indicators,moving averages,SMA,DMA,EMA,ADX,MACD,RSISellas Life SLS WideScreen charts, DMA,SMA,EMA technical analysis, forecast prediction, by indicators ADX,MACD,RSI,CCI NASDAQ stock exchange
operates under Health Care sector & deals in Major Pharmaceuticals
Daily price and charts and targets SellasLife Strong Daily Stock price targets for SellasLife SLS are 1.64 and 1.81 | Daily Target 1 | 1.6 | | Daily Target 2 | 1.67 | | Daily Target 3 | 1.7666666666667 | | Daily Target 4 | 1.84 | | Daily Target 5 | 1.94 |
Daily price and volume Sellas Life
| Date |
Closing |
Open |
Range |
Volume |
Fri 05 December 2025 |
1.75 (0.57%) |
1.84 |
1.69 - 1.86 |
0.9906 times |
Thu 04 December 2025 |
1.74 (12.99%) |
1.55 |
1.52 - 1.84 |
2.5249 times |
Wed 03 December 2025 |
1.54 (10.79%) |
1.41 |
1.41 - 1.55 |
0.9282 times |
Tue 02 December 2025 |
1.39 (-7.33%) |
1.52 |
1.39 - 1.55 |
1.1554 times |
Mon 01 December 2025 |
1.50 (-7.41%) |
1.58 |
1.50 - 1.60 |
0.6729 times |
Fri 28 November 2025 |
1.62 (11.72%) |
1.47 |
1.47 - 1.64 |
0.5467 times |
Wed 26 November 2025 |
1.45 (0.69%) |
1.48 |
1.42 - 1.50 |
0.8951 times |
Tue 25 November 2025 |
1.44 (-7.69%) |
1.56 |
1.43 - 1.59 |
0.8602 times |
Mon 24 November 2025 |
1.56 (1.96%) |
1.56 |
1.51 - 1.61 |
0.6743 times |
Fri 21 November 2025 |
1.53 (4.79%) |
1.51 |
1.50 - 1.56 |
0.7517 times |
Thu 20 November 2025 |
1.46 (-3.95%) |
1.56 |
1.45 - 1.61 |
0.512 times |
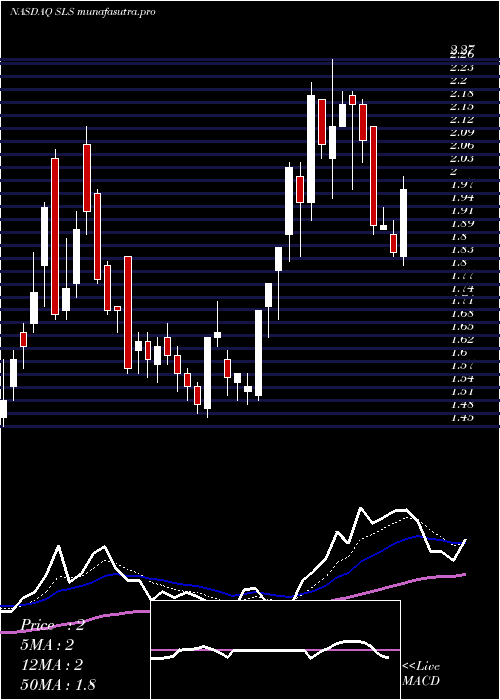
Weekly price and charts SellasLife Strong weekly Stock price targets for SellasLife SLS are 1.57 and 2.04 | Weekly Target 1 | 1.2 | | Weekly Target 2 | 1.47 | | Weekly Target 3 | 1.6666666666667 | | Weekly Target 4 | 1.94 | | Weekly Target 5 | 2.14 |
Weekly price and volumes for Sellas Life
| Date |
Closing |
Open |
Range |
Volume |
Fri 05 December 2025 |
1.75 (8.02%) |
1.58 |
1.39 - 1.86 |
1.3062 times |
Fri 28 November 2025 |
1.62 (5.88%) |
1.56 |
1.42 - 1.64 |
0.6199 times |
Fri 21 November 2025 |
1.53 (6.99%) |
1.40 |
1.39 - 1.65 |
0.8929 times |
Fri 14 November 2025 |
1.43 (-9.49%) |
1.62 |
1.40 - 1.65 |
0.9945 times |
Fri 07 November 2025 |
1.58 (-13.19%) |
1.75 |
1.54 - 1.77 |
0.6191 times |
Fri 31 October 2025 |
1.82 (0%) |
1.91 |
1.81 - 1.93 |
0.2437 times |
Fri 31 October 2025 |
1.82 (-8.54%) |
1.96 |
1.81 - 2.12 |
1.2723 times |
Fri 24 October 2025 |
1.99 (-32.54%) |
2.71 |
1.85 - 2.85 |
1.884 times |
Fri 17 October 2025 |
2.95 (54.45%) |
1.99 |
1.88 - 3.20 |
1.6036 times |
Fri 10 October 2025 |
1.91 (2.14%) |
1.90 |
1.81 - 1.95 |
0.5638 times |
Fri 03 October 2025 |
1.87 (14.72%) |
1.61 |
1.55 - 1.90 |
0.7766 times |
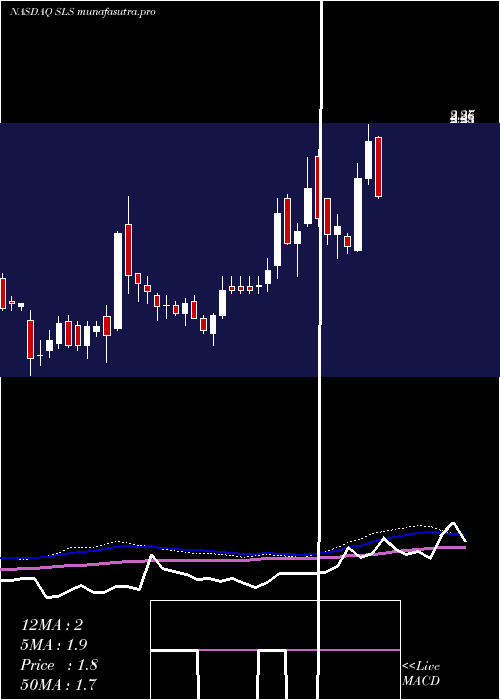
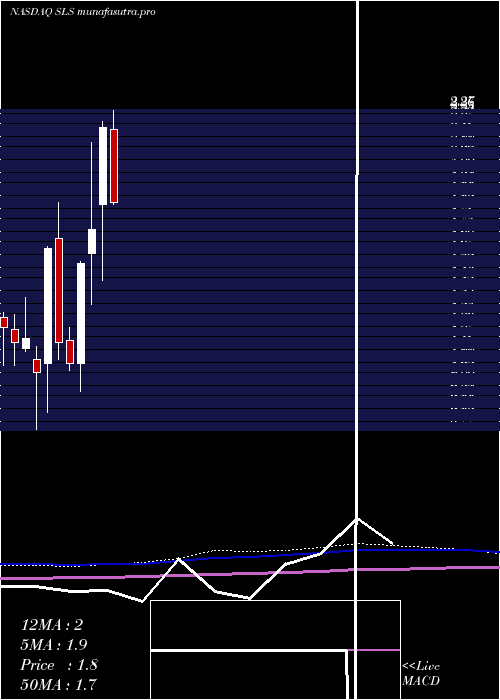
Monthly price and charts SellasLife Strong monthly Stock price targets for SellasLife SLS are 1.57 and 2.04 | Monthly Target 1 | 1.2 | | Monthly Target 2 | 1.47 | | Monthly Target 3 | 1.6666666666667 | | Monthly Target 4 | 1.94 | | Monthly Target 5 | 2.14 |
Monthly price and volumes Sellas Life
| Date |
Closing |
Open |
Range |
Volume |
Fri 05 December 2025 |
1.75 (8.02%) |
1.58 |
1.39 - 1.86 |
0.4741 times |
Fri 28 November 2025 |
1.62 (-10.99%) |
1.75 |
1.39 - 1.77 |
1.1347 times |
Fri 31 October 2025 |
1.82 (13.04%) |
1.63 |
1.60 - 3.20 |
2.2005 times |
Tue 30 September 2025 |
1.61 (-16.15%) |
1.95 |
1.55 - 1.95 |
0.8781 times |
Fri 29 August 2025 |
1.92 (20.75%) |
1.59 |
1.50 - 2.01 |
0.7342 times |
Thu 31 July 2025 |
1.59 (-27.4%) |
2.18 |
1.59 - 2.27 |
1.1837 times |
Mon 30 June 2025 |
2.19 (28.07%) |
1.83 |
1.47 - 2.22 |
1.2699 times |
Fri 30 May 2025 |
1.71 (10.32%) |
1.60 |
1.36 - 2.12 |
1.2144 times |
Wed 30 April 2025 |
1.55 (43.52%) |
1.08 |
0.95 - 1.56 |
0.5771 times |
Mon 31 March 2025 |
1.08 (-8.47%) |
1.19 |
1.05 - 1.25 |
0.3332 times |
Fri 28 February 2025 |
1.18 (-27.16%) |
1.67 |
1.10 - 1.84 |
0.7043 times |
DMA SMA EMA moving averages of Sellas Life SLS
DMA (daily moving average) of Sellas Life SLS
| DMA period | DMA value | | 5 day DMA | 1.58 | | 12 day DMA | 1.54 | | 20 day DMA | 1.52 | | 35 day DMA | 1.71 | | 50 day DMA | 1.75 | | 100 day DMA | 1.75 | | 150 day DMA | 1.76 | | 200 day DMA | 1.62 | EMA (exponential moving average) of Sellas Life SLS
| EMA period | EMA current | EMA prev | EMA prev2 | | 5 day EMA | 1.64 | 1.58 | 1.5 | | 12 day EMA | 1.58 | 1.55 | 1.51 | | 20 day EMA | 1.58 | 1.56 | 1.54 | | 35 day EMA | 1.65 | 1.64 | 1.63 | | 50 day EMA | 1.73 | 1.73 | 1.73 |
SMA (simple moving average) of Sellas Life SLS
| SMA period | SMA current | SMA prev | SMA prev2 | | 5 day SMA | 1.58 | 1.56 | 1.5 | | 12 day SMA | 1.54 | 1.53 | 1.5 | | 20 day SMA | 1.52 | 1.52 | 1.51 | | 35 day SMA | 1.71 | 1.72 | 1.73 | | 50 day SMA | 1.75 | 1.75 | 1.75 | | 100 day SMA | 1.75 | 1.75 | 1.75 | | 150 day SMA | 1.76 | 1.75 | 1.75 | | 200 day SMA | 1.62 | 1.62 | 1.61 |
|
|
