SolGel SLGL full analysis,charts,indicators,moving averages,SMA,DMA,EMA,ADX,MACD,RSISol Gel SLGL WideScreen charts, DMA,SMA,EMA technical analysis, forecast prediction, by indicators ADX,MACD,RSI,CCI NASDAQ stock exchange
operates under Health Care sector & deals in Major Pharmaceuticals
Daily price and charts and targets SolGel Strong Daily Stock price targets for SolGel SLGL are 38.06 and 40.75 | Daily Target 1 | 37.25 | | Daily Target 2 | 38.87 | | Daily Target 3 | 39.936666666667 | | Daily Target 4 | 41.56 | | Daily Target 5 | 42.63 |
Daily price and volume Sol Gel
| Date |
Closing |
Open |
Range |
Volume |
Fri 05 December 2025 |
40.50 (-0.49%) |
41.00 |
38.31 - 41.00 |
0.8948 times |
Thu 04 December 2025 |
40.70 (2.31%) |
39.33 |
39.25 - 40.70 |
1.0466 times |
Wed 03 December 2025 |
39.78 (2.71%) |
37.30 |
37.30 - 40.00 |
1.6323 times |
Tue 02 December 2025 |
38.73 (0.16%) |
38.96 |
38.73 - 39.07 |
0.3362 times |
Mon 01 December 2025 |
38.67 (-8.84%) |
42.00 |
34.47 - 42.11 |
2.603 times |
Fri 28 November 2025 |
42.42 (4.25%) |
41.96 |
40.57 - 45.47 |
1.2364 times |
Wed 26 November 2025 |
40.69 (0.74%) |
39.98 |
38.13 - 42.00 |
0.4338 times |
Tue 25 November 2025 |
40.39 (-3.28%) |
41.70 |
38.95 - 42.00 |
0.6508 times |
Mon 24 November 2025 |
41.76 (13.94%) |
37.00 |
34.77 - 41.85 |
0.9653 times |
Fri 21 November 2025 |
36.65 (2.52%) |
37.49 |
36.33 - 37.49 |
0.2007 times |
Thu 20 November 2025 |
35.75 (-0.8%) |
37.18 |
34.10 - 37.95 |
1.3286 times |
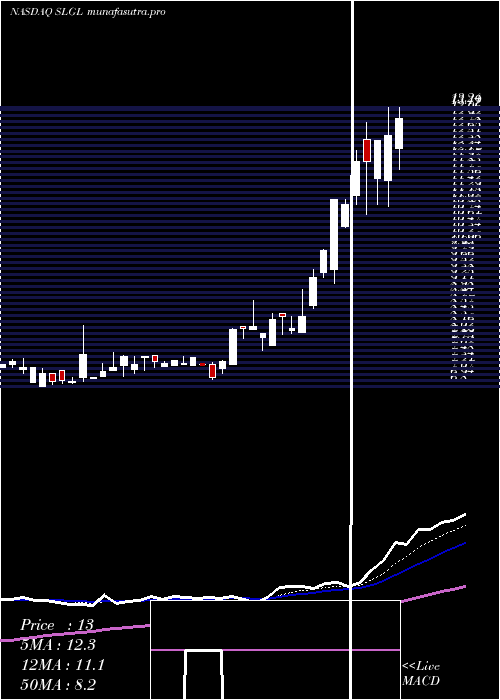
Weekly price and charts SolGel Strong weekly Stock price targets for SolGel SLGL are 33.67 and 41.31 | Weekly Target 1 | 31.39 | | Weekly Target 2 | 35.94 | | Weekly Target 3 | 39.026666666667 | | Weekly Target 4 | 43.58 | | Weekly Target 5 | 46.67 |
Weekly price and volumes for Sol Gel
| Date |
Closing |
Open |
Range |
Volume |
Fri 05 December 2025 |
40.50 (-4.53%) |
42.00 |
34.47 - 42.11 |
1.4609 times |
Fri 28 November 2025 |
42.42 (15.74%) |
37.00 |
34.77 - 45.47 |
0.7371 times |
Fri 21 November 2025 |
36.65 (7.79%) |
34.99 |
32.51 - 37.95 |
0.7335 times |
Fri 14 November 2025 |
34.00 (11%) |
30.10 |
28.81 - 38.37 |
2.5411 times |
Fri 07 November 2025 |
30.63 (-11.22%) |
34.01 |
29.94 - 35.50 |
0.3369 times |
Fri 31 October 2025 |
34.50 (0%) |
36.50 |
34.50 - 36.50 |
0.18 times |
Fri 31 October 2025 |
34.50 (-11.54%) |
40.94 |
34.50 - 42.00 |
0.8174 times |
Fri 24 October 2025 |
39.00 (-3.94%) |
39.90 |
37.00 - 43.53 |
0.6447 times |
Fri 17 October 2025 |
40.60 (4.13%) |
39.45 |
34.20 - 42.96 |
0.8916 times |
Fri 10 October 2025 |
38.99 (12.04%) |
35.00 |
34.80 - 52.26 |
1.6567 times |
Fri 03 October 2025 |
34.80 (20.04%) |
28.61 |
27.00 - 36.05 |
0.6168 times |
Monthly price and charts SolGel Strong monthly Stock price targets for SolGel SLGL are 33.67 and 41.31 | Monthly Target 1 | 31.39 | | Monthly Target 2 | 35.94 | | Monthly Target 3 | 39.026666666667 | | Monthly Target 4 | 43.58 | | Monthly Target 5 | 46.67 |
Monthly price and volumes Sol Gel
| Date |
Closing |
Open |
Range |
Volume |
Fri 05 December 2025 |
40.50 (-4.53%) |
42.00 |
34.47 - 42.11 |
0.1002 times |
Fri 28 November 2025 |
42.42 (22.96%) |
34.01 |
28.81 - 45.47 |
0.2982 times |
Fri 31 October 2025 |
34.50 (18.35%) |
30.32 |
27.00 - 52.26 |
0.3108 times |
Tue 30 September 2025 |
29.15 (27.91%) |
23.94 |
22.04 - 30.98 |
0.366 times |
Fri 29 August 2025 |
22.79 (80.87%) |
12.30 |
11.82 - 26.89 |
0.5002 times |
Thu 31 July 2025 |
12.60 (70.27%) |
7.30 |
6.96 - 13.24 |
0.2165 times |
Mon 30 June 2025 |
7.40 (2.64%) |
7.20 |
6.80 - 8.21 |
0.4147 times |
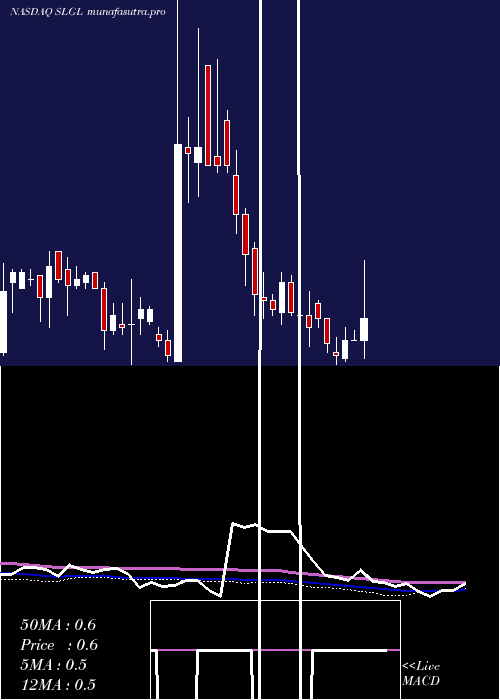
Fri 30 May 2025 |
7.21 (848.68%) |
0.70 |
0.69 - 8.26 |
0.9867 times |
Wed 30 April 2025 |
0.76 (46.15%) |
0.52 |
0.40 - 0.90 |
6.3984 times |
Mon 31 March 2025 |
0.52 (-22.39%) |
0.67 |
0.46 - 0.69 |
0.4083 times |
Fri 28 February 2025 |
0.67 (-11.84%) |
0.78 |
0.53 - 0.80 |
0.9842 times |

DMA SMA EMA moving averages of Sol Gel SLGL
DMA (daily moving average) of Sol Gel SLGL
| DMA period | DMA value | | 5 day DMA | 39.68 | | 12 day DMA | 39.34 | | 20 day DMA | 36.98 | | 35 day DMA | 37.02 | | 50 day DMA | 36.81 | | 100 day DMA | 28.1 | | 150 day DMA | 21.12 | | 200 day DMA | 15.98 | EMA (exponential moving average) of Sol Gel SLGL
| EMA period | EMA current | EMA prev | EMA prev2 | | 5 day EMA | 40.12 | 39.93 | 39.55 | | 12 day EMA | 39.12 | 38.87 | 38.54 | | 20 day EMA | 38.16 | 37.91 | 37.62 | | 35 day EMA | 37.2 | 37.01 | 36.79 | | 50 day EMA | 36.43 | 36.26 | 36.08 |
SMA (simple moving average) of Sol Gel SLGL
| SMA period | SMA current | SMA prev | SMA prev2 | | 5 day SMA | 39.68 | 40.06 | 40.06 | | 12 day SMA | 39.34 | 38.92 | 38.52 | | 20 day SMA | 36.98 | 36.55 | 36.15 | | 35 day SMA | 37.02 | 37.02 | 37.05 | | 50 day SMA | 36.81 | 36.56 | 36.3 | | 100 day SMA | 28.1 | 27.78 | 27.45 | | 150 day SMA | 21.12 | 20.85 | 20.59 | | 200 day SMA | 15.98 | 15.78 | 15.58 |
|
|
