SkywestInc SKYW full analysis,charts,indicators,moving averages,SMA,DMA,EMA,ADX,MACD,RSISkywest Inc SKYW WideScreen charts, DMA,SMA,EMA technical analysis, forecast prediction, by indicators ADX,MACD,RSI,CCI NASDAQ stock exchange
operates under Transportation sector & deals in Air Freight Delivery Services
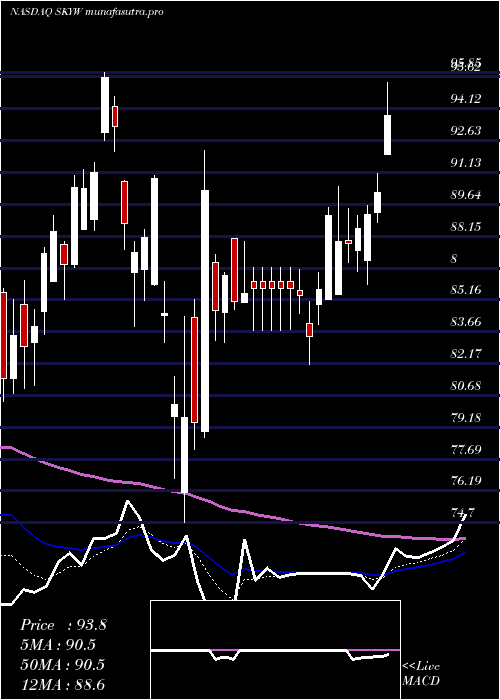
Daily price and charts and targets SkywestInc Strong Daily Stock price targets for SkywestInc SKYW are 102.03 and 105.01 | Daily Target 1 | 99.58 | | Daily Target 2 | 101.49 | | Daily Target 3 | 102.56 | | Daily Target 4 | 104.47 | | Daily Target 5 | 105.54 |
Daily price and volume Skywest Inc
| Date |
Closing |
Open |
Range |
Volume |
Fri 05 December 2025 |
103.40 (1.24%) |
101.40 |
100.65 - 103.63 |
0.9096 times |
Thu 04 December 2025 |
102.13 (-1.08%) |
102.79 |
101.90 - 104.14 |
1.1105 times |
Wed 03 December 2025 |
103.24 (2.33%) |
101.09 |
100.92 - 103.50 |
0.9548 times |
Tue 02 December 2025 |
100.89 (1.61%) |
100.21 |
99.04 - 101.50 |
0.3884 times |
Mon 01 December 2025 |
99.29 (-2.2%) |
99.56 |
98.73 - 101.15 |
1.1802 times |
Fri 28 November 2025 |
101.52 (0.3%) |
101.00 |
99.52 - 102.33 |
0.5486 times |
Wed 26 November 2025 |
101.22 (1.89%) |
98.86 |
98.86 - 102.75 |
1.8145 times |
Tue 25 November 2025 |
99.34 (3.27%) |
96.97 |
96.94 - 100.06 |
1.0327 times |
Mon 24 November 2025 |
96.19 (0.84%) |
95.34 |
94.88 - 97.00 |
0.9232 times |
Fri 21 November 2025 |
95.39 (3.09%) |
92.99 |
92.99 - 96.51 |
1.1374 times |
Thu 20 November 2025 |
92.53 (-0.69%) |
94.98 |
91.84 - 95.07 |
1.2507 times |
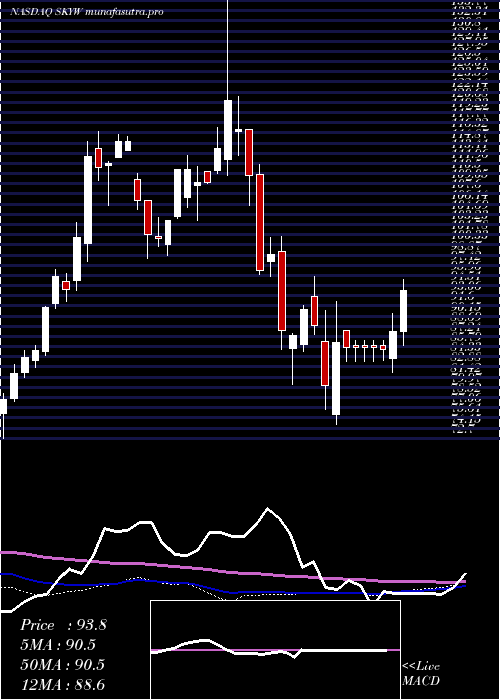
Weekly price and charts SkywestInc Strong weekly Stock price targets for SkywestInc SKYW are 101.07 and 106.48 | Weekly Target 1 | 96.68 | | Weekly Target 2 | 100.04 | | Weekly Target 3 | 102.09 | | Weekly Target 4 | 105.45 | | Weekly Target 5 | 107.5 |
Weekly price and volumes for Skywest Inc
| Date |
Closing |
Open |
Range |
Volume |
Fri 05 December 2025 |
103.40 (1.85%) |
99.56 |
98.73 - 104.14 |
1.0186 times |
Fri 28 November 2025 |
101.52 (6.43%) |
95.34 |
94.88 - 102.75 |
0.9683 times |
Fri 21 November 2025 |
95.39 (-1.25%) |
96.69 |
91.84 - 96.69 |
1.1529 times |
Fri 14 November 2025 |
96.60 (-2.03%) |
99.21 |
96.21 - 101.54 |
1.1163 times |
Fri 07 November 2025 |
98.60 (-1.87%) |
99.00 |
94.87 - 99.86 |
0.7376 times |
Fri 31 October 2025 |
100.48 (0%) |
99.45 |
96.50 - 103.00 |
0.4705 times |
Fri 31 October 2025 |
100.48 (0.13%) |
100.00 |
94.98 - 103.00 |
1.5217 times |
Fri 24 October 2025 |
100.35 (1.29%) |
99.43 |
98.74 - 102.42 |
0.6644 times |
Fri 17 October 2025 |
99.07 (1.88%) |
98.02 |
96.00 - 102.07 |
1.0196 times |
Fri 10 October 2025 |
97.24 (-2.78%) |
100.84 |
97.06 - 102.59 |
1.3301 times |
Fri 03 October 2025 |
100.02 (-1.75%) |
102.44 |
98.76 - 103.00 |
1.5806 times |
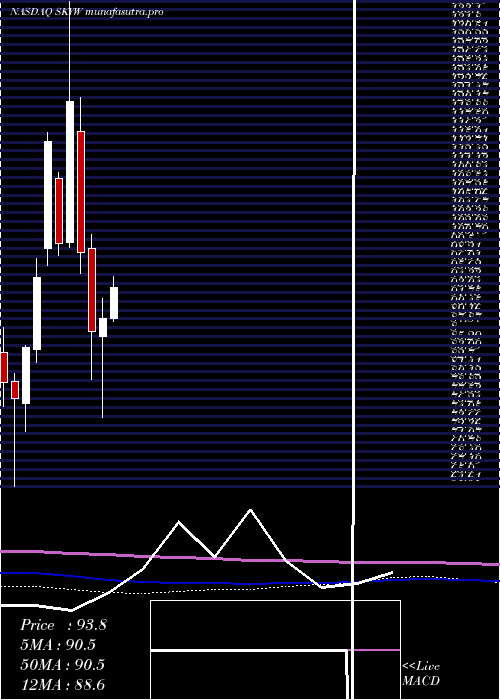
Monthly price and charts SkywestInc Strong monthly Stock price targets for SkywestInc SKYW are 101.07 and 106.48 | Monthly Target 1 | 96.68 | | Monthly Target 2 | 100.04 | | Monthly Target 3 | 102.09 | | Monthly Target 4 | 105.45 | | Monthly Target 5 | 107.5 |
Monthly price and volumes Skywest Inc
| Date |
Closing |
Open |
Range |
Volume |
Fri 05 December 2025 |
103.40 (1.85%) |
99.56 |
98.73 - 104.14 |
0.1713 times |
Fri 28 November 2025 |
101.52 (1.04%) |
99.00 |
91.84 - 102.75 |
0.6684 times |
Fri 31 October 2025 |
100.48 (-0.14%) |
102.67 |
94.98 - 103.00 |
0.9912 times |
Tue 30 September 2025 |
100.62 (-17.12%) |
119.82 |
99.10 - 123.67 |
1.2089 times |
Fri 29 August 2025 |
121.40 (4.69%) |
113.13 |
107.24 - 123.94 |
0.9284 times |
Thu 31 July 2025 |
115.96 (12.62%) |
104.46 |
102.63 - 119.43 |
1.2889 times |
Mon 30 June 2025 |
102.97 (1.5%) |
100.81 |
93.28 - 104.59 |
0.7854 times |
Fri 30 May 2025 |
101.45 (13.77%) |
89.28 |
88.80 - 106.11 |
0.9355 times |
Wed 30 April 2025 |
89.17 (2.06%) |
86.60 |
74.70 - 92.18 |
1.2847 times |
Mon 31 March 2025 |
87.37 (-11.67%) |
99.44 |
80.37 - 101.47 |
1.7372 times |
Fri 28 February 2025 |
98.91 (-18.2%) |
116.51 |
95.82 - 121.55 |
1.2736 times |
DMA SMA EMA moving averages of Skywest Inc SKYW
DMA (daily moving average) of Skywest Inc SKYW
| DMA period | DMA value | | 5 day DMA | 101.79 | | 12 day DMA | 99.03 | | 20 day DMA | 98.27 | | 35 day DMA | 98.58 | | 50 day DMA | 99.06 | | 100 day DMA | 106.11 | | 150 day DMA | 104.74 | | 200 day DMA | 100.69 | EMA (exponential moving average) of Skywest Inc SKYW
| EMA period | EMA current | EMA prev | EMA prev2 | | 5 day EMA | 102.03 | 101.34 | 100.94 | | 12 day EMA | 100.21 | 99.63 | 99.18 | | 20 day EMA | 99.4 | 98.98 | 98.65 | | 35 day EMA | 99.28 | 99.04 | 98.86 | | 50 day EMA | 99.67 | 99.52 | 99.41 |
SMA (simple moving average) of Skywest Inc SKYW
| SMA period | SMA current | SMA prev | SMA prev2 | | 5 day SMA | 101.79 | 101.41 | 101.23 | | 12 day SMA | 99.03 | 98.22 | 97.45 | | 20 day SMA | 98.27 | 97.95 | 97.78 | | 35 day SMA | 98.58 | 98.5 | 98.49 | | 50 day SMA | 99.06 | 99.03 | 99.04 | | 100 day SMA | 106.11 | 106.19 | 106.28 | | 150 day SMA | 104.74 | 104.65 | 104.57 | | 200 day SMA | 100.69 | 100.68 | 100.68 |
|
|
