SuperiorGroup SGC full analysis,charts,indicators,moving averages,SMA,DMA,EMA,ADX,MACD,RSISuperior Group SGC WideScreen charts, DMA,SMA,EMA technical analysis, forecast prediction, by indicators ADX,MACD,RSI,CCI NASDAQ stock exchange
operates under Consumer Non Durables sector & deals in Apparel
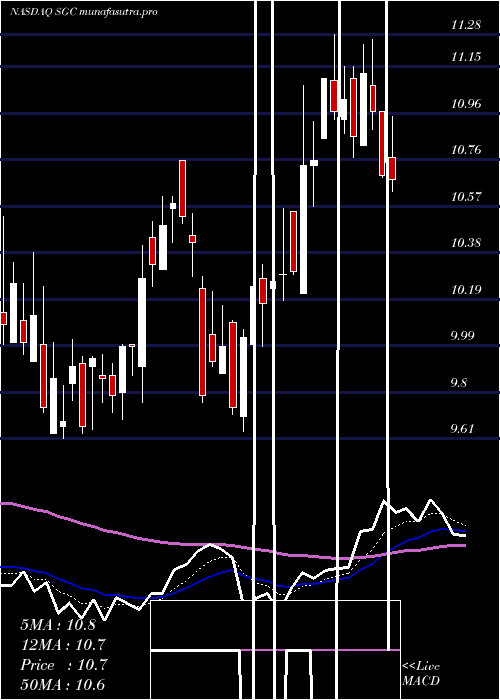
Daily price and charts and targets SuperiorGroup Strong Daily Stock price targets for SuperiorGroup SGC are 9.5 and 10.25 | Daily Target 1 | 9.37 | | Daily Target 2 | 9.62 | | Daily Target 3 | 10.116666666667 | | Daily Target 4 | 10.37 | | Daily Target 5 | 10.87 |
Daily price and volume Superior Group
| Date |
Closing |
Open |
Range |
Volume |
Wed 30 July 2025 |
9.88 (-6.08%) |
10.61 |
9.86 - 10.61 |
0.605 times |
Tue 29 July 2025 |
10.52 (-2.5%) |
10.93 |
10.49 - 10.93 |
0.5033 times |
Mon 28 July 2025 |
10.79 (-1.73%) |
11.01 |
10.59 - 11.03 |
1.3793 times |
Fri 25 July 2025 |
10.98 (0.92%) |
10.78 |
10.78 - 11.00 |
0.3581 times |
Thu 24 July 2025 |
10.88 (-4.06%) |
11.30 |
10.80 - 11.46 |
1.7181 times |
Wed 23 July 2025 |
11.34 (0.53%) |
11.44 |
11.23 - 11.58 |
1.043 times |
Tue 22 July 2025 |
11.28 (3.58%) |
10.98 |
10.98 - 11.50 |
1.3842 times |
Mon 21 July 2025 |
10.89 (2.74%) |
10.61 |
10.61 - 11.05 |
0.6751 times |
Fri 18 July 2025 |
10.60 (-0.93%) |
10.72 |
10.46 - 10.80 |
0.9598 times |
Thu 17 July 2025 |
10.70 (-0.37%) |
10.83 |
10.62 - 10.96 |
1.374 times |
Wed 16 July 2025 |
10.74 (0.56%) |
10.81 |
10.46 - 10.86 |
0.6727 times |
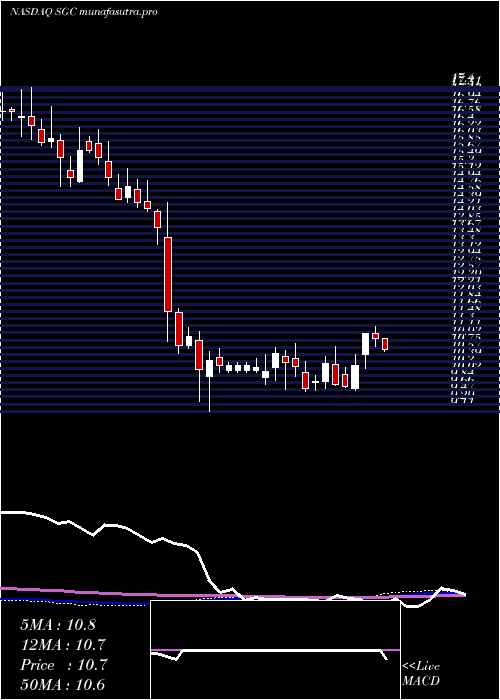
Weekly price and charts SuperiorGroup Strong weekly Stock price targets for SuperiorGroup SGC are 9.29 and 10.46 | Weekly Target 1 | 9.09 | | Weekly Target 2 | 9.48 | | Weekly Target 3 | 10.256666666667 | | Weekly Target 4 | 10.65 | | Weekly Target 5 | 11.43 |
Weekly price and volumes for Superior Group
| Date |
Closing |
Open |
Range |
Volume |
Wed 30 July 2025 |
9.88 (-10.02%) |
11.01 |
9.86 - 11.03 |
0.4972 times |
Fri 25 July 2025 |
10.98 (3.58%) |
10.61 |
10.61 - 11.58 |
1.0351 times |
Fri 18 July 2025 |
10.60 (-3.28%) |
10.96 |
10.46 - 10.96 |
0.9695 times |
Fri 11 July 2025 |
10.96 (-1.26%) |
11.09 |
10.77 - 11.28 |
0.845 times |
Thu 03 July 2025 |
11.10 (7.87%) |
10.55 |
10.21 - 11.10 |
0.9292 times |
Fri 27 June 2025 |
10.29 (5.65%) |
9.70 |
9.64 - 10.56 |
1.8109 times |
Fri 20 June 2025 |
9.74 (-0.51%) |
10.04 |
9.71 - 10.22 |
0.8914 times |
Fri 13 June 2025 |
9.79 (-5.23%) |
10.31 |
9.76 - 10.76 |
1.008 times |
Fri 06 June 2025 |
10.33 (4.77%) |
9.87 |
9.69 - 10.51 |
1.2639 times |
Fri 30 May 2025 |
9.86 (1.86%) |
9.84 |
9.63 - 10.02 |
0.7497 times |
Fri 23 May 2025 |
9.68 (-5.56%) |
10.10 |
9.61 - 10.38 |
0.9509 times |
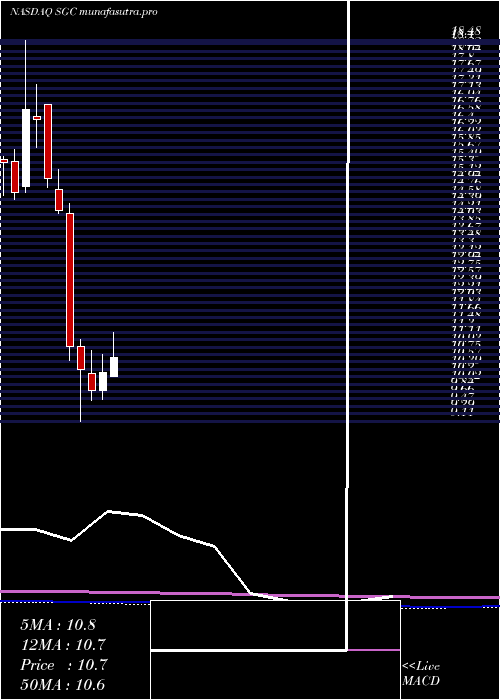
Monthly price and charts SuperiorGroup Strong monthly Stock price targets for SuperiorGroup SGC are 9.01 and 10.73 | Monthly Target 1 | 8.72 | | Monthly Target 2 | 9.3 | | Monthly Target 3 | 10.44 | | Monthly Target 4 | 11.02 | | Monthly Target 5 | 12.16 |
Monthly price and volumes Superior Group
| Date |
Closing |
Open |
Range |
Volume |
Wed 30 July 2025 |
9.88 (-4.08%) |
10.21 |
9.86 - 11.58 |
0.8548 times |
Mon 30 June 2025 |
10.30 (4.46%) |
9.87 |
9.64 - 10.76 |
1.1082 times |
Fri 30 May 2025 |
9.86 (-5.01%) |
10.27 |
9.61 - 10.84 |
1.0303 times |
Wed 30 April 2025 |
10.38 (-5.12%) |
10.95 |
9.11 - 11.11 |
1.1582 times |
Mon 31 March 2025 |
10.94 (-23.44%) |
14.23 |
10.60 - 14.46 |
1.3383 times |
Fri 28 February 2025 |
14.29 (-5.3%) |
14.82 |
14.22 - 15.31 |
0.7882 times |
Fri 31 January 2025 |
15.09 (-8.71%) |
16.91 |
14.87 - 16.91 |
0.878 times |
Tue 31 December 2024 |
16.53 (-1.55%) |
16.62 |
15.85 - 17.40 |
0.7638 times |
Tue 26 November 2024 |
16.79 (13.83%) |
14.88 |
14.74 - 18.48 |
1.076 times |
Thu 31 October 2024 |
14.75 (-4.78%) |
15.50 |
14.58 - 15.79 |
1.0042 times |
Mon 30 September 2024 |
15.49 (6.98%) |
14.45 |
13.77 - 15.68 |
1.9582 times |
DMA SMA EMA moving averages of Superior Group SGC
DMA (daily moving average) of Superior Group SGC
| DMA period | DMA value | | 5 day DMA | 10.61 | | 12 day DMA | 10.77 | | 20 day DMA | 10.84 | | 35 day DMA | 10.58 | | 50 day DMA | 10.39 | | 100 day DMA | 10.54 | | 150 day DMA | 12.09 | | 200 day DMA | 13.06 | EMA (exponential moving average) of Superior Group SGC
| EMA period | EMA current | EMA prev | EMA prev2 | | 5 day EMA | 10.49 | 10.79 | 10.93 | | 12 day EMA | 10.68 | 10.83 | 10.89 | | 20 day EMA | 10.7 | 10.79 | 10.82 | | 35 day EMA | 10.58 | 10.62 | 10.63 | | 50 day EMA | 10.4 | 10.42 | 10.42 |
SMA (simple moving average) of Superior Group SGC
| SMA period | SMA current | SMA prev | SMA prev2 | | 5 day SMA | 10.61 | 10.9 | 11.05 | | 12 day SMA | 10.77 | 10.84 | 10.88 | | 20 day SMA | 10.84 | 10.88 | 10.87 | | 35 day SMA | 10.58 | 10.59 | 10.58 | | 50 day SMA | 10.39 | 10.4 | 10.39 | | 100 day SMA | 10.54 | 10.58 | 10.61 | | 150 day SMA | 12.09 | 12.13 | 12.17 | | 200 day SMA | 13.06 | 13.09 | 13.11 |
|
|
