SafetyInsurance SAFT full analysis,charts,indicators,moving averages,SMA,DMA,EMA,ADX,MACD,RSISafety Insurance SAFT WideScreen charts, DMA,SMA,EMA technical analysis, forecast prediction, by indicators ADX,MACD,RSI,CCI NASDAQ stock exchange
operates under Finance sector & deals in Property Casualty Insurers
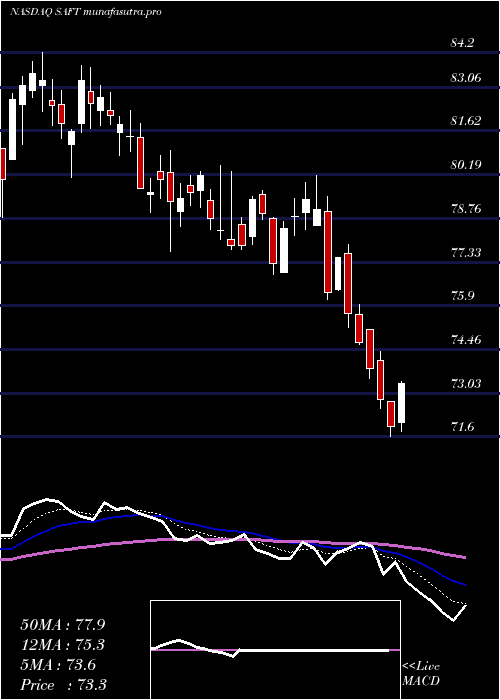
Daily price and charts and targets SafetyInsurance Strong Daily Stock price targets for SafetyInsurance SAFT are 73.59 and 74.71 | Daily Target 1 | 73.25 | | Daily Target 2 | 73.93 | | Daily Target 3 | 74.373333333333 | | Daily Target 4 | 75.05 | | Daily Target 5 | 75.49 |
Daily price and volume Safety Insurance
| Date |
Closing |
Open |
Range |
Volume |
Fri 05 December 2025 |
74.60 (-0.36%) |
74.65 |
73.70 - 74.82 |
0.9234 times |
Thu 04 December 2025 |
74.87 (-1.64%) |
75.78 |
74.75 - 76.10 |
0.8278 times |
Wed 03 December 2025 |
76.12 (0.21%) |
76.19 |
75.38 - 77.37 |
0.7654 times |
Tue 02 December 2025 |
75.96 (0.9%) |
75.48 |
74.63 - 76.43 |
0.9827 times |
Mon 01 December 2025 |
75.28 (-0.97%) |
75.00 |
74.87 - 76.03 |
1.1346 times |
Fri 28 November 2025 |
76.02 (-1.27%) |
77.28 |
75.93 - 78.15 |
0.3621 times |
Wed 26 November 2025 |
77.00 (0.59%) |
76.50 |
76.20 - 77.87 |
1.6546 times |
Tue 25 November 2025 |
76.55 (0.82%) |
76.50 |
75.94 - 77.09 |
1.1778 times |
Mon 24 November 2025 |
75.93 (-1.31%) |
76.75 |
75.35 - 76.81 |
0.9234 times |
Fri 21 November 2025 |
76.94 (1.34%) |
75.92 |
75.81 - 77.48 |
1.2482 times |
Thu 20 November 2025 |
75.92 (1.04%) |
75.78 |
75.19 - 76.02 |
0.7232 times |
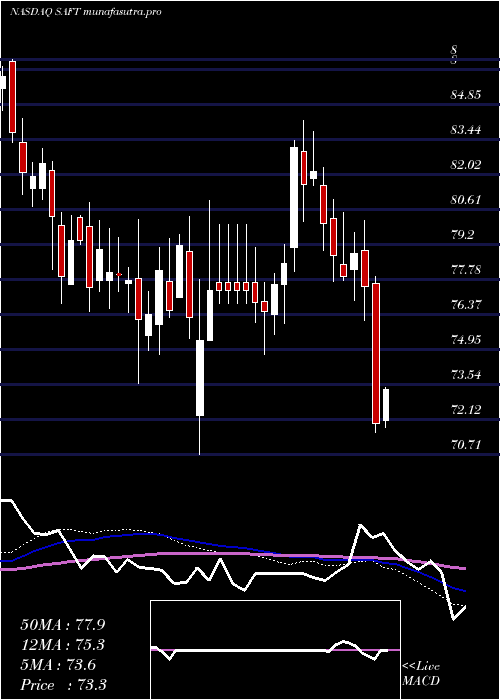
Weekly price and charts SafetyInsurance Strong weekly Stock price targets for SafetyInsurance SAFT are 72.32 and 75.99 | Weekly Target 1 | 71.55 | | Weekly Target 2 | 73.08 | | Weekly Target 3 | 75.223333333333 | | Weekly Target 4 | 76.75 | | Weekly Target 5 | 78.89 |
Weekly price and volumes for Safety Insurance
| Date |
Closing |
Open |
Range |
Volume |
Fri 05 December 2025 |
74.60 (-1.87%) |
75.00 |
73.70 - 77.37 |
1.2619 times |
Fri 28 November 2025 |
76.02 (-1.2%) |
76.75 |
75.35 - 78.15 |
1.1214 times |
Fri 21 November 2025 |
76.94 (-0.4%) |
77.25 |
74.98 - 77.67 |
1.1502 times |
Fri 14 November 2025 |
77.25 (3.51%) |
74.53 |
74.38 - 78.06 |
1.6076 times |
Fri 07 November 2025 |
74.63 (8.58%) |
68.43 |
68.29 - 75.00 |
1.0359 times |
Fri 31 October 2025 |
68.73 (0%) |
68.51 |
67.85 - 69.45 |
0.2416 times |
Fri 31 October 2025 |
68.73 (-1.19%) |
69.56 |
67.04 - 69.75 |
0.9886 times |
Fri 24 October 2025 |
69.56 (0.09%) |
69.45 |
68.59 - 70.71 |
0.7215 times |
Fri 17 October 2025 |
69.50 (0.59%) |
69.38 |
68.10 - 70.37 |
0.9617 times |
Fri 10 October 2025 |
69.09 (-2.57%) |
71.08 |
68.49 - 72.00 |
0.9097 times |
Fri 03 October 2025 |
70.91 (-0.39%) |
71.20 |
69.34 - 71.94 |
0.832 times |
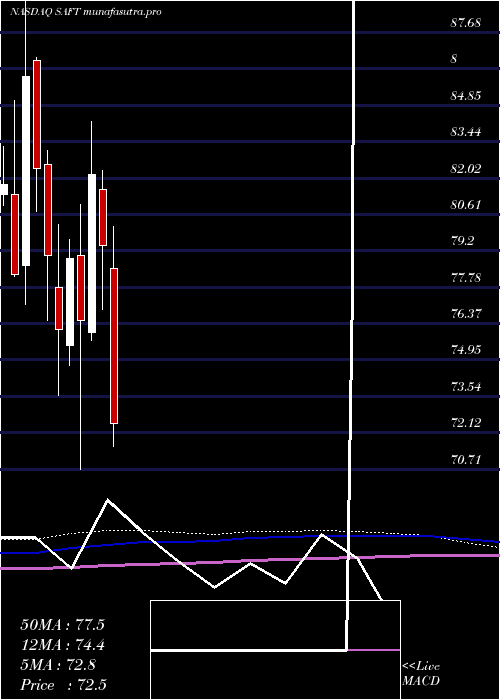
Monthly price and charts SafetyInsurance Strong monthly Stock price targets for SafetyInsurance SAFT are 72.32 and 75.99 | Monthly Target 1 | 71.55 | | Monthly Target 2 | 73.08 | | Monthly Target 3 | 75.223333333333 | | Monthly Target 4 | 76.75 | | Monthly Target 5 | 78.89 |
Monthly price and volumes Safety Insurance
| Date |
Closing |
Open |
Range |
Volume |
Fri 05 December 2025 |
74.60 (-1.87%) |
75.00 |
73.70 - 77.37 |
0.3119 times |
Fri 28 November 2025 |
76.02 (10.61%) |
68.43 |
68.29 - 78.15 |
1.215 times |
Fri 31 October 2025 |
68.73 (-2.77%) |
70.36 |
67.04 - 72.00 |
1.0621 times |
Tue 30 September 2025 |
70.69 (-4.49%) |
72.82 |
70.31 - 75.07 |
1.2153 times |
Fri 29 August 2025 |
74.01 (5.2%) |
69.81 |
68.91 - 76.13 |
1.4504 times |
Thu 31 July 2025 |
70.35 (-11.39%) |
78.52 |
69.62 - 80.15 |
1.2668 times |
Mon 30 June 2025 |
79.39 (-3.35%) |
81.57 |
76.91 - 82.30 |
1.1021 times |
Fri 30 May 2025 |
82.14 (7.37%) |
76.02 |
75.69 - 84.20 |
0.6338 times |
Wed 30 April 2025 |
76.50 (-3.02%) |
79.01 |
70.71 - 80.99 |
0.8339 times |
Mon 31 March 2025 |
78.88 (3.6%) |
75.52 |
74.73 - 79.64 |
0.9086 times |
Fri 28 February 2025 |
76.14 (-3.63%) |
77.75 |
73.55 - 80.22 |
0.6485 times |
DMA SMA EMA moving averages of Safety Insurance SAFT
DMA (daily moving average) of Safety Insurance SAFT
| DMA period | DMA value | | 5 day DMA | 75.37 | | 12 day DMA | 75.86 | | 20 day DMA | 76.1 | | 35 day DMA | 73.35 | | 50 day DMA | 72.32 | | 100 day DMA | 72.39 | | 150 day DMA | 74.55 | | 200 day DMA | 75.18 | EMA (exponential moving average) of Safety Insurance SAFT
| EMA period | EMA current | EMA prev | EMA prev2 | | 5 day EMA | 75.29 | 75.64 | 76.03 | | 12 day EMA | 75.52 | 75.69 | 75.84 | | 20 day EMA | 75.08 | 75.13 | 75.16 | | 35 day EMA | 74.1 | 74.07 | 74.02 | | 50 day EMA | 72.57 | 72.49 | 72.39 |
SMA (simple moving average) of Safety Insurance SAFT
| SMA period | SMA current | SMA prev | SMA prev2 | | 5 day SMA | 75.37 | 75.65 | 76.08 | | 12 day SMA | 75.86 | 75.99 | 76.1 | | 20 day SMA | 76.1 | 76.05 | 75.9 | | 35 day SMA | 73.35 | 73.17 | 73.03 | | 50 day SMA | 72.32 | 72.25 | 72.2 | | 100 day SMA | 72.39 | 72.37 | 72.33 | | 150 day SMA | 74.55 | 74.56 | 74.57 | | 200 day SMA | 75.18 | 75.19 | 75.2 |
|
|
