RhythmPharmaceuticals RYTM full analysis,charts,indicators,moving averages,SMA,DMA,EMA,ADX,MACD,RSIRhythm Pharmaceuticals RYTM WideScreen charts, DMA,SMA,EMA technical analysis, forecast prediction, by indicators ADX,MACD,RSI,CCI NASDAQ stock exchange
operates under Health Care sector & deals in Major Pharmaceuticals
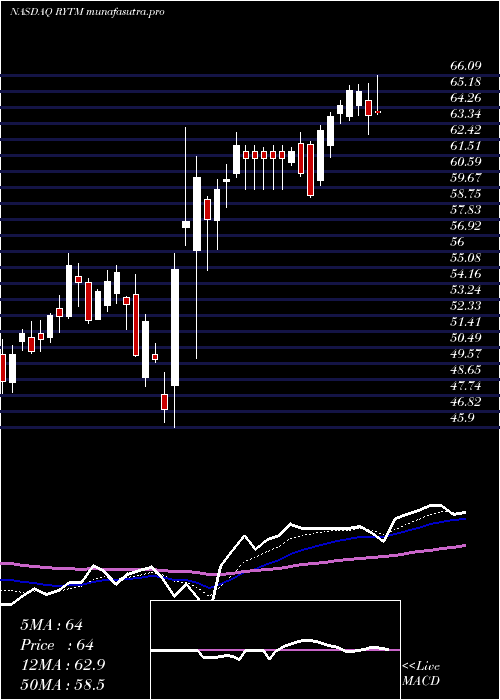
Daily price and charts and targets RhythmPharmaceuticals Strong Daily Stock price targets for RhythmPharmaceuticals RYTM are 87.91 and 90.73 | Daily Target 1 | 85.62 | | Daily Target 2 | 87.38 | | Daily Target 3 | 88.436666666667 | | Daily Target 4 | 90.2 | | Daily Target 5 | 91.26 |
Daily price and volume Rhythm Pharmaceuticals
| Date |
Closing |
Open |
Range |
Volume |
Mon 14 July 2025 |
89.15 (2.83%) |
86.67 |
86.67 - 89.49 |
0.5303 times |
Fri 11 July 2025 |
86.70 (-2.63%) |
89.59 |
86.25 - 90.36 |
0.7959 times |
Thu 10 July 2025 |
89.04 (0.04%) |
91.80 |
87.39 - 94.80 |
1.828 times |
Wed 09 July 2025 |
89.00 (36.63%) |
76.75 |
75.01 - 89.05 |
3.4526 times |
Tue 08 July 2025 |
65.14 (-1.88%) |
66.15 |
64.65 - 67.17 |
0.3987 times |
Mon 07 July 2025 |
66.39 (0.94%) |
66.76 |
65.69 - 66.83 |
0.5917 times |
Thu 03 July 2025 |
65.77 (-1.72%) |
67.05 |
65.61 - 67.44 |
0.4524 times |
Wed 02 July 2025 |
66.92 (2.26%) |
64.81 |
64.81 - 67.75 |
0.6951 times |
Tue 01 July 2025 |
65.44 (3.56%) |
63.06 |
62.84 - 66.21 |
0.6901 times |
Mon 30 June 2025 |
63.19 (0.73%) |
62.83 |
62.29 - 64.00 |
0.5653 times |
Fri 27 June 2025 |
62.73 (2.08%) |
61.74 |
61.00 - 62.92 |
0.6177 times |
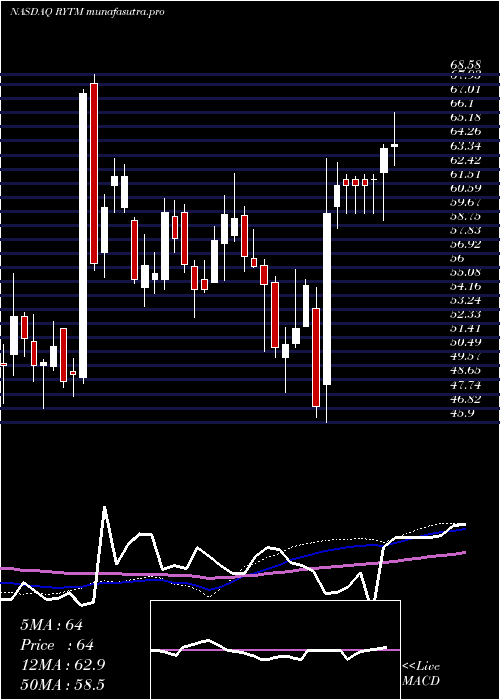
Weekly price and charts RhythmPharmaceuticals Strong weekly Stock price targets for RhythmPharmaceuticals RYTM are 87.91 and 90.73 | Weekly Target 1 | 85.62 | | Weekly Target 2 | 87.38 | | Weekly Target 3 | 88.436666666667 | | Weekly Target 4 | 90.2 | | Weekly Target 5 | 91.26 |
Weekly price and volumes for Rhythm Pharmaceuticals
| Date |
Closing |
Open |
Range |
Volume |
Mon 14 July 2025 |
89.15 (2.83%) |
86.67 |
86.67 - 89.49 |
0.2273 times |
Fri 11 July 2025 |
86.70 (31.82%) |
66.76 |
64.65 - 94.80 |
3.0285 times |
Thu 03 July 2025 |
65.77 (4.85%) |
62.83 |
62.29 - 67.75 |
1.0298 times |
Fri 27 June 2025 |
62.73 (1.19%) |
61.98 |
60.80 - 64.00 |
0.8946 times |
Fri 20 June 2025 |
61.99 (-1.45%) |
61.75 |
60.70 - 62.65 |
0.5382 times |
Fri 13 June 2025 |
62.90 (-7.65%) |
69.70 |
61.45 - 69.89 |
0.9053 times |
Fri 06 June 2025 |
68.11 (11.05%) |
61.81 |
60.80 - 68.26 |
0.9331 times |
Fri 30 May 2025 |
61.33 (-1.65%) |
62.75 |
58.71 - 63.66 |
0.6455 times |
Fri 23 May 2025 |
62.36 (4.05%) |
59.79 |
59.17 - 64.50 |
0.7594 times |
Fri 16 May 2025 |
59.93 (4.44%) |
58.52 |
55.31 - 60.96 |
1.0385 times |
Fri 09 May 2025 |
57.38 (-10.36%) |
63.97 |
57.28 - 65.53 |
1.3168 times |
Monthly price and charts RhythmPharmaceuticals Strong monthly Stock price targets for RhythmPharmaceuticals RYTM are 76 and 107.96 | Monthly Target 1 | 50.3 | | Monthly Target 2 | 69.73 | | Monthly Target 3 | 82.263333333333 | | Monthly Target 4 | 101.69 | | Monthly Target 5 | 114.22 |
Monthly price and volumes Rhythm Pharmaceuticals
| Date |
Closing |
Open |
Range |
Volume |
Mon 14 July 2025 |
89.15 (41.08%) |
63.06 |
62.84 - 94.80 |
1.1002 times |
Mon 30 June 2025 |
63.19 (3.03%) |
61.81 |
60.70 - 69.89 |
0.956 times |
Fri 30 May 2025 |
61.33 (-5.92%) |
64.65 |
55.31 - 66.09 |
1.1194 times |
Wed 30 April 2025 |
65.19 (23.07%) |
53.53 |
45.90 - 65.58 |
1.6398 times |
Mon 31 March 2025 |
52.97 (-3.53%) |
55.03 |
47.86 - 55.87 |
0.8821 times |
Fri 28 February 2025 |
54.91 (-7.61%) |
58.06 |
50.50 - 62.14 |
0.7752 times |
Fri 31 January 2025 |
59.43 (6.16%) |
57.34 |
52.71 - 60.69 |
0.9511 times |
Tue 31 December 2024 |
55.98 (-9.64%) |
59.04 |
53.43 - 59.28 |
0.6932 times |
Tue 26 November 2024 |
61.95 (29.79%) |
47.88 |
47.88 - 68.58 |
1.2848 times |
Thu 31 October 2024 |
47.73 (-8.89%) |
52.16 |
46.80 - 52.74 |
0.5982 times |
Mon 30 September 2024 |
52.39 (10.78%) |
46.76 |
45.00 - 55.64 |
0.8223 times |

DMA SMA EMA moving averages of Rhythm Pharmaceuticals RYTM
DMA (daily moving average) of Rhythm Pharmaceuticals RYTM
| DMA period | DMA value | | 5 day DMA | 83.81 | | 12 day DMA | 72.58 | | 20 day DMA | 68.52 | | 35 day DMA | 66.46 | | 50 day DMA | 64.94 | | 100 day DMA | 60.36 | | 150 day DMA | 59.31 | | 200 day DMA | 57.91 | EMA (exponential moving average) of Rhythm Pharmaceuticals RYTM
| EMA period | EMA current | EMA prev | EMA prev2 | | 5 day EMA | 83.88 | 81.24 | 78.51 | | 12 day EMA | 76.2 | 73.85 | 71.51 | | 20 day EMA | 72.16 | 70.37 | 68.65 | | 35 day EMA | 68.51 | 67.29 | 66.15 | | 50 day EMA | 66.73 | 65.82 | 64.97 |
SMA (simple moving average) of Rhythm Pharmaceuticals RYTM
| SMA period | SMA current | SMA prev | SMA prev2 | | 5 day SMA | 83.81 | 79.25 | 75.07 | | 12 day SMA | 72.58 | 70.34 | 68.42 | | 20 day SMA | 68.52 | 67.3 | 66.34 | | 35 day SMA | 66.46 | 65.74 | 65.01 | | 50 day SMA | 64.94 | 64.47 | 64.02 | | 100 day SMA | 60.36 | 60.04 | 59.74 | | 150 day SMA | 59.31 | 59.13 | 58.95 | | 200 day SMA | 57.91 | 57.73 | 57.55 |
|
|
