RevolutionMedicines RVMD full analysis,charts,indicators,moving averages,SMA,DMA,EMA,ADX,MACD,RSIRevolution Medicines RVMD WideScreen charts, DMA,SMA,EMA technical analysis, forecast prediction, by indicators ADX,MACD,RSI,CCI NASDAQ stock exchange
Daily price and charts and targets RevolutionMedicines Strong Daily Stock price targets for RevolutionMedicines RVMD are 78.77 and 80.7 | Daily Target 1 | 77.19 | | Daily Target 2 | 78.41 | | Daily Target 3 | 79.116666666667 | | Daily Target 4 | 80.34 | | Daily Target 5 | 81.05 |
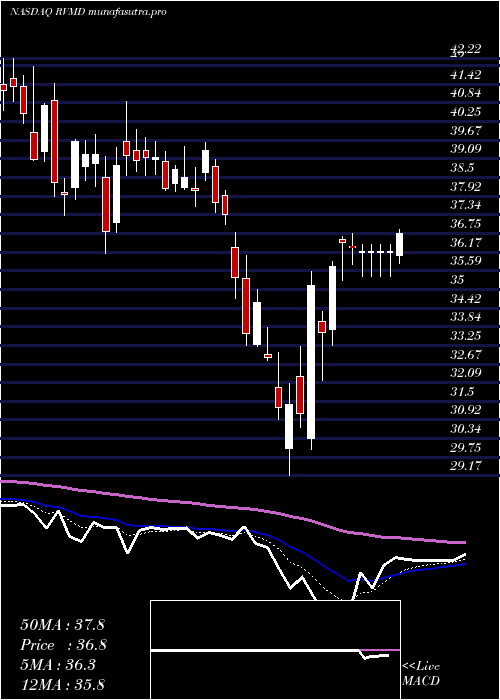
Daily price and volume Revolution Medicines
| Date |
Closing |
Open |
Range |
Volume |
Fri 05 December 2025 |
79.64 (1.45%) |
78.48 |
77.89 - 79.82 |
0.9906 times |
Thu 04 December 2025 |
78.50 (1.04%) |
77.49 |
76.53 - 79.06 |
0.7143 times |
Wed 03 December 2025 |
77.69 (3.16%) |
75.55 |
74.52 - 79.07 |
1.7933 times |
Tue 02 December 2025 |
75.31 (-0.65%) |
75.50 |
74.97 - 77.22 |
0.8635 times |
Mon 01 December 2025 |
75.80 (-2.52%) |
77.06 |
75.11 - 77.32 |
0.9611 times |
Fri 28 November 2025 |
77.76 (0.23%) |
77.68 |
76.60 - 77.98 |
0.4916 times |
Wed 26 November 2025 |
77.58 (1.61%) |
76.12 |
75.65 - 78.17 |
0.8665 times |
Tue 25 November 2025 |
76.35 (3.65%) |
74.26 |
73.44 - 76.41 |
0.6157 times |
Mon 24 November 2025 |
73.66 (3.94%) |
71.26 |
71.15 - 73.98 |
1.5802 times |
Fri 21 November 2025 |
70.87 (1.42%) |
70.07 |
69.50 - 71.97 |
1.1231 times |
Thu 20 November 2025 |
69.88 (-0.92%) |
71.65 |
69.75 - 72.72 |
1.3602 times |
Weekly price and charts RevolutionMedicines Strong weekly Stock price targets for RevolutionMedicines RVMD are 77.08 and 82.38 | Weekly Target 1 | 72.69 | | Weekly Target 2 | 76.17 | | Weekly Target 3 | 77.993333333333 | | Weekly Target 4 | 81.47 | | Weekly Target 5 | 83.29 |
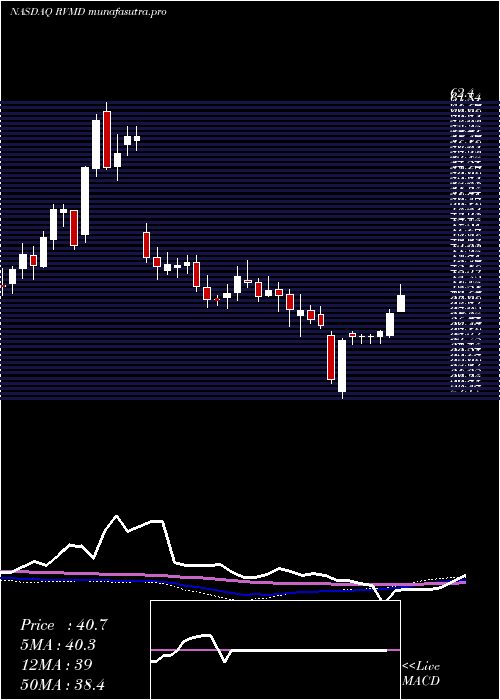
Weekly price and volumes for Revolution Medicines
| Date |
Closing |
Open |
Range |
Volume |
Fri 05 December 2025 |
79.64 (2.42%) |
77.06 |
74.52 - 79.82 |
0.9875 times |
Fri 28 November 2025 |
77.76 (9.72%) |
71.26 |
71.15 - 78.17 |
0.6594 times |
Fri 21 November 2025 |
70.87 (4.61%) |
67.65 |
67.27 - 72.72 |
1.1264 times |
Fri 14 November 2025 |
67.75 (11.07%) |
61.74 |
61.50 - 69.02 |
1.5055 times |
Fri 07 November 2025 |
61.00 (3.67%) |
57.99 |
57.74 - 64.48 |
0.9012 times |
Fri 31 October 2025 |
58.84 (0%) |
58.96 |
58.28 - 59.74 |
0.2552 times |
Fri 31 October 2025 |
58.84 (8%) |
55.53 |
55.40 - 60.08 |
1.2613 times |
Fri 24 October 2025 |
54.48 (0.7%) |
55.00 |
52.48 - 55.32 |
1.0124 times |
Fri 17 October 2025 |
54.10 (12.15%) |
48.24 |
47.45 - 56.18 |
1.2564 times |
Fri 10 October 2025 |
48.24 (3.28%) |
46.90 |
45.80 - 49.50 |
1.0348 times |
Fri 03 October 2025 |
46.71 (6.35%) |
44.05 |
42.97 - 47.60 |
1.226 times |
Monthly price and charts RevolutionMedicines Strong monthly Stock price targets for RevolutionMedicines RVMD are 77.08 and 82.38 | Monthly Target 1 | 72.69 | | Monthly Target 2 | 76.17 | | Monthly Target 3 | 77.993333333333 | | Monthly Target 4 | 81.47 | | Monthly Target 5 | 83.29 |
Monthly price and volumes Revolution Medicines
| Date |
Closing |
Open |
Range |
Volume |
Fri 05 December 2025 |
79.64 (2.42%) |
77.06 |
74.52 - 79.82 |
0.2309 times |
Fri 28 November 2025 |
77.76 (32.15%) |
57.99 |
57.74 - 78.17 |
0.9803 times |
Fri 31 October 2025 |
58.84 (26%) |
46.54 |
42.97 - 60.08 |
1.278 times |
Tue 30 September 2025 |
46.70 (22.99%) |
37.97 |
37.88 - 47.22 |
1.1845 times |
Fri 29 August 2025 |
37.97 (1.88%) |
37.00 |
34.00 - 39.54 |
1.0855 times |
Thu 31 July 2025 |
37.27 (1.3%) |
36.85 |
36.37 - 39.62 |
0.9111 times |
Mon 30 June 2025 |
36.79 (-6.62%) |
39.51 |
36.61 - 42.40 |
1.5227 times |
Fri 30 May 2025 |
39.40 (-2.43%) |
40.40 |
36.36 - 43.67 |
1.0642 times |
Wed 30 April 2025 |
40.38 (14.2%) |
35.35 |
29.17 - 41.96 |
1.0939 times |
Mon 31 March 2025 |
35.36 (-13.21%) |
40.90 |
34.72 - 41.44 |
0.6488 times |
Fri 28 February 2025 |
40.74 (-5.15%) |
42.43 |
38.99 - 44.68 |
0.599 times |

DMA SMA EMA moving averages of Revolution Medicines RVMD
DMA (daily moving average) of Revolution Medicines RVMD
| DMA period | DMA value | | 5 day DMA | 77.39 | | 12 day DMA | 75.3 | | 20 day DMA | 71.45 | | 35 day DMA | 65.19 | | 50 day DMA | 59.85 | | 100 day DMA | 49.48 | | 150 day DMA | 46.05 | | 200 day DMA | 43.96 | EMA (exponential moving average) of Revolution Medicines RVMD
| EMA period | EMA current | EMA prev | EMA prev2 | | 5 day EMA | 77.87 | 76.99 | 76.24 | | 12 day EMA | 75.07 | 74.24 | 73.47 | | 20 day EMA | 71.75 | 70.92 | 70.12 | | 35 day EMA | 66.1 | 65.3 | 64.52 | | 50 day EMA | 60.29 | 59.5 | 58.72 |
SMA (simple moving average) of Revolution Medicines RVMD
| SMA period | SMA current | SMA prev | SMA prev2 | | 5 day SMA | 77.39 | 77.01 | 76.83 | | 12 day SMA | 75.3 | 74.54 | 73.76 | | 20 day SMA | 71.45 | 70.54 | 69.58 | | 35 day SMA | 65.19 | 64.44 | 63.62 | | 50 day SMA | 59.85 | 59.11 | 58.41 | | 100 day SMA | 49.48 | 49.07 | 48.66 | | 150 day SMA | 46.05 | 45.79 | 45.54 | | 200 day SMA | 43.96 | 43.77 | 43.59 |
|
|
