SignatureGroup RELY full analysis,charts,indicators,moving averages,SMA,DMA,EMA,ADX,MACD,RSISignature Group RELY WideScreen charts, DMA,SMA,EMA technical analysis, forecast prediction, by indicators ADX,MACD,RSI,CCI NASDAQ stock exchange
operates under Consumer Non-Durables sector & deals in Telecommunications Equipment
Daily price and charts and targets SignatureGroup Strong Daily Stock price targets for SignatureGroup RELY are 13.4 and 13.82 | Daily Target 1 | 13.11 | | Daily Target 2 | 13.27 | | Daily Target 3 | 13.53 | | Daily Target 4 | 13.69 | | Daily Target 5 | 13.95 |
Daily price and volume Signature Group
| Date |
Closing |
Open |
Range |
Volume |
Fri 05 December 2025 |
13.43 (-0.22%) |
13.38 |
13.37 - 13.79 |
1.1416 times |
Thu 04 December 2025 |
13.46 (1.13%) |
13.38 |
13.18 - 13.47 |
0.5069 times |
Wed 03 December 2025 |
13.31 (2.94%) |
13.00 |
12.99 - 13.46 |
1.2795 times |
Tue 02 December 2025 |
12.93 (-2.27%) |
13.23 |
12.88 - 13.35 |
1.0224 times |
Mon 01 December 2025 |
13.23 (-2.36%) |
13.35 |
13.16 - 13.51 |
1.0813 times |
Fri 28 November 2025 |
13.55 (1.42%) |
13.35 |
13.35 - 13.59 |
0.5016 times |
Wed 26 November 2025 |
13.36 (3.17%) |
13.00 |
12.92 - 13.40 |
0.6639 times |
Tue 25 November 2025 |
12.95 (3.77%) |
12.50 |
12.45 - 12.98 |
1.6259 times |
Mon 24 November 2025 |
12.48 (-0.08%) |
12.47 |
12.33 - 12.62 |
0.753 times |
Fri 21 November 2025 |
12.49 (0.73%) |
12.42 |
12.31 - 12.67 |
1.424 times |
Thu 20 November 2025 |
12.40 (-1.67%) |
12.77 |
12.35 - 12.84 |
1.7698 times |
Weekly price and charts SignatureGroup Strong weekly Stock price targets for SignatureGroup RELY are 13.16 and 14.07 | Weekly Target 1 | 12.46 | | Weekly Target 2 | 12.94 | | Weekly Target 3 | 13.366666666667 | | Weekly Target 4 | 13.85 | | Weekly Target 5 | 14.28 |
Weekly price and volumes for Signature Group
| Date |
Closing |
Open |
Range |
Volume |
Fri 05 December 2025 |
13.43 (-0.89%) |
13.35 |
12.88 - 13.79 |
0.76 times |
Fri 28 November 2025 |
13.55 (8.49%) |
12.47 |
12.33 - 13.59 |
0.5353 times |
Fri 21 November 2025 |
12.49 (0.64%) |
12.52 |
12.31 - 12.99 |
1.1651 times |
Fri 14 November 2025 |
12.41 (-2.36%) |
12.87 |
12.08 - 13.13 |
1.5397 times |
Fri 07 November 2025 |
12.71 (-20.76%) |
16.44 |
12.16 - 16.75 |
2.4746 times |
Fri 31 October 2025 |
16.04 (0%) |
15.77 |
15.77 - 16.11 |
0.1875 times |
Fri 31 October 2025 |
16.04 (-6.8%) |
17.36 |
15.75 - 17.55 |
0.8968 times |
Fri 24 October 2025 |
17.21 (10.39%) |
15.60 |
15.60 - 17.50 |
0.8243 times |
Fri 17 October 2025 |
15.59 (4%) |
15.10 |
14.72 - 16.13 |
0.8884 times |
Fri 10 October 2025 |
14.99 (-6.89%) |
16.21 |
14.96 - 16.27 |
0.7283 times |
Fri 03 October 2025 |
16.10 (-1.83%) |
16.49 |
15.90 - 16.74 |
0.6778 times |
Monthly price and charts SignatureGroup Strong monthly Stock price targets for SignatureGroup RELY are 13.16 and 14.07 | Monthly Target 1 | 12.46 | | Monthly Target 2 | 12.94 | | Monthly Target 3 | 13.366666666667 | | Monthly Target 4 | 13.85 | | Monthly Target 5 | 14.28 |
Monthly price and volumes Signature Group
| Date |
Closing |
Open |
Range |
Volume |
Fri 05 December 2025 |
13.43 (-0.89%) |
13.35 |
12.88 - 13.79 |
0.193 times |
Fri 28 November 2025 |
13.55 (-15.52%) |
16.44 |
12.08 - 16.75 |
1.4509 times |
Fri 31 October 2025 |
16.04 (-1.6%) |
16.20 |
14.72 - 17.55 |
0.9792 times |
Tue 30 September 2025 |
16.30 (-12.03%) |
18.42 |
16.04 - 21.00 |
1.1523 times |
Fri 29 August 2025 |
18.53 (12.3%) |
16.41 |
15.62 - 20.15 |
1.4507 times |
Thu 31 July 2025 |
16.50 (-12.09%) |
18.70 |
16.50 - 18.83 |
1.2572 times |
Mon 30 June 2025 |
18.77 (-12.13%) |
20.80 |
18.55 - 22.07 |
1.029 times |
Fri 30 May 2025 |
21.36 (5.64%) |
20.44 |
19.92 - 24.71 |
1.0012 times |
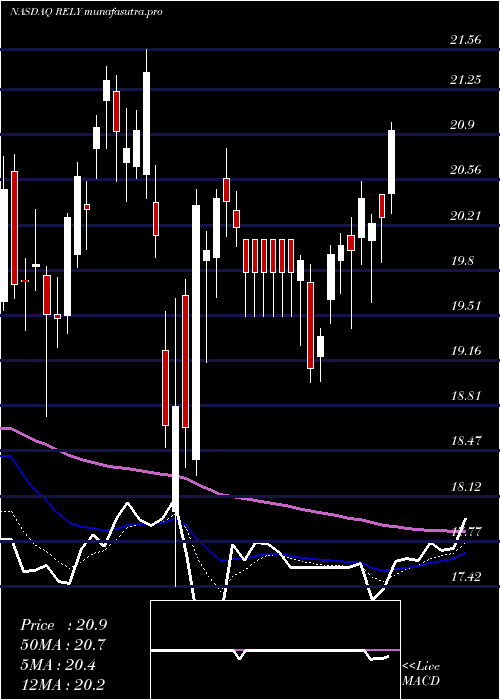
Wed 30 April 2025 |
20.22 (-2.79%) |
20.66 |
17.42 - 21.56 |
0.6399 times |
Mon 31 March 2025 |
20.80 (-13.33%) |
23.92 |
18.73 - 24.33 |
0.8466 times |
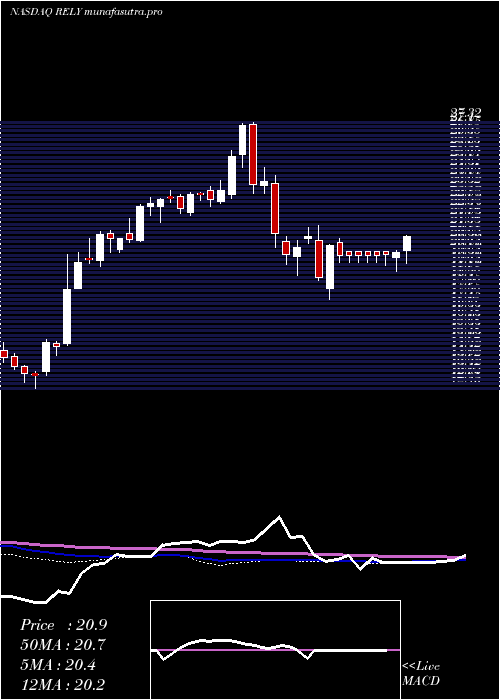
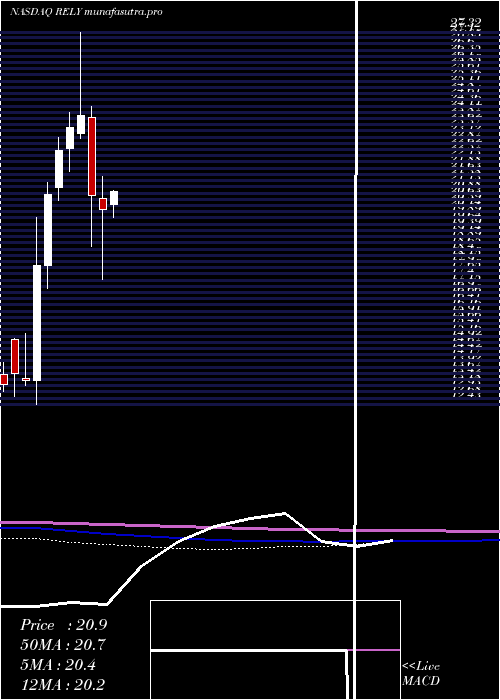
Fri 28 February 2025 |
24.00 (2.13%) |
23.26 |
23.08 - 27.32 |
0.7358 times |
DMA SMA EMA moving averages of Signature Group RELY
DMA (daily moving average) of Signature Group RELY
| DMA period | DMA value | | 5 day DMA | 13.27 | | 12 day DMA | 13.02 | | 20 day DMA | 12.83 | | 35 day DMA | 14.24 | | 50 day DMA | 14.7 | | 100 day DMA | 16.38 | | 150 day DMA | 17.79 | | 200 day DMA | 18.51 | EMA (exponential moving average) of Signature Group RELY
| EMA period | EMA current | EMA prev | EMA prev2 | | 5 day EMA | 13.32 | 13.26 | 13.16 | | 12 day EMA | 13.21 | 13.17 | 13.12 | | 20 day EMA | 13.41 | 13.41 | 13.4 | | 35 day EMA | 13.93 | 13.96 | 13.99 | | 50 day EMA | 14.73 | 14.78 | 14.83 |
SMA (simple moving average) of Signature Group RELY
| SMA period | SMA current | SMA prev | SMA prev2 | | 5 day SMA | 13.27 | 13.3 | 13.28 | | 12 day SMA | 13.02 | 12.97 | 12.89 | | 20 day SMA | 12.83 | 12.77 | 12.92 | | 35 day SMA | 14.24 | 14.29 | 14.35 | | 50 day SMA | 14.7 | 14.75 | 14.81 | | 100 day SMA | 16.38 | 16.42 | 16.46 | | 150 day SMA | 17.79 | 17.83 | 17.88 | | 200 day SMA | 18.51 | 18.56 | 18.62 |
|
|
