RichardsonElectronics RELL full analysis,charts,indicators,moving averages,SMA,DMA,EMA,ADX,MACD,RSIRichardson Electronics RELL WideScreen charts, DMA,SMA,EMA technical analysis, forecast prediction, by indicators ADX,MACD,RSI,CCI NASDAQ stock exchange
operates under Consumer Non Durables sector & deals in Electronic Components
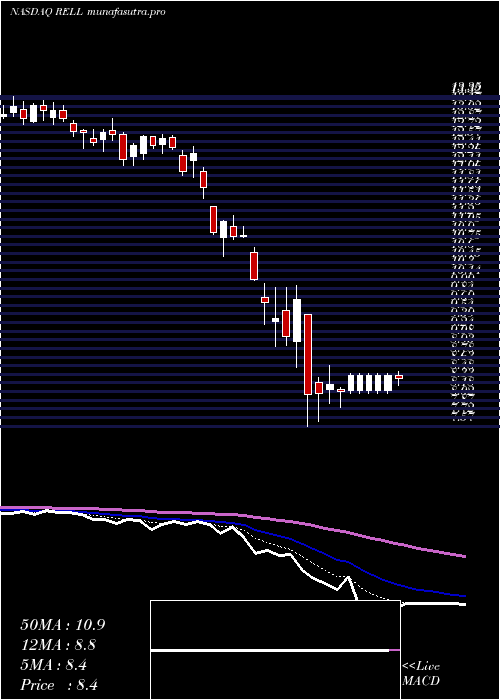
Daily price and charts and targets RichardsonElectronics Strong Daily Stock price targets for RichardsonElectronics RELL are 10.46 and 10.66 | Daily Target 1 | 10.42 | | Daily Target 2 | 10.49 | | Daily Target 3 | 10.62 | | Daily Target 4 | 10.69 | | Daily Target 5 | 10.82 |
Daily price and volume Richardson Electronics
| Date |
Closing |
Open |
Range |
Volume |
Fri 05 December 2025 |
10.56 (-0.94%) |
10.66 |
10.55 - 10.75 |
0.7763 times |
Thu 04 December 2025 |
10.66 (-1.39%) |
10.83 |
10.32 - 10.88 |
0.6388 times |
Wed 03 December 2025 |
10.81 (1.98%) |
10.62 |
10.55 - 10.88 |
1.9929 times |
Tue 02 December 2025 |
10.60 (2.81%) |
10.41 |
10.39 - 10.68 |
0.7803 times |
Mon 01 December 2025 |
10.31 (-1.43%) |
10.22 |
10.16 - 10.50 |
0.9473 times |
Fri 28 November 2025 |
10.46 (-0.38%) |
10.48 |
10.27 - 10.48 |
0.4619 times |
Wed 26 November 2025 |
10.50 (2.84%) |
10.29 |
10.18 - 10.62 |
1.1616 times |
Tue 25 November 2025 |
10.21 (3.44%) |
9.91 |
9.89 - 10.28 |
1.1144 times |
Mon 24 November 2025 |
9.87 (1.65%) |
9.67 |
9.67 - 9.91 |
0.5503 times |
Fri 21 November 2025 |
9.71 (2.97%) |
9.44 |
9.37 - 9.90 |
1.5763 times |
Thu 20 November 2025 |
9.43 (-3.68%) |
10.11 |
9.40 - 10.28 |
1.4957 times |
Weekly price and charts RichardsonElectronics Strong weekly Stock price targets for RichardsonElectronics RELL are 10.36 and 11.08 | Weekly Target 1 | 9.81 | | Weekly Target 2 | 10.19 | | Weekly Target 3 | 10.533333333333 | | Weekly Target 4 | 10.91 | | Weekly Target 5 | 11.25 |
Weekly price and volumes for Richardson Electronics
| Date |
Closing |
Open |
Range |
Volume |
Fri 05 December 2025 |
10.56 (0.96%) |
10.22 |
10.16 - 10.88 |
0.5618 times |
Fri 28 November 2025 |
10.46 (7.72%) |
9.67 |
9.67 - 10.62 |
0.3597 times |
Fri 21 November 2025 |
9.71 (-6.45%) |
10.31 |
9.37 - 10.51 |
0.7202 times |
Fri 14 November 2025 |
10.38 (-0.29%) |
10.50 |
10.22 - 10.84 |
0.5308 times |
Fri 07 November 2025 |
10.41 (-3.43%) |
10.67 |
9.96 - 11.07 |
0.6016 times |
Fri 31 October 2025 |
10.78 (0%) |
10.83 |
10.59 - 10.96 |
0.1215 times |
Fri 31 October 2025 |
10.78 (0.65%) |
10.86 |
10.59 - 11.23 |
0.7366 times |
Fri 24 October 2025 |
10.71 (-2.19%) |
11.15 |
10.57 - 11.48 |
0.737 times |
Fri 17 October 2025 |
10.95 (-2.67%) |
12.13 |
10.84 - 12.49 |
1.6703 times |
Fri 10 October 2025 |
11.25 (17.31%) |
9.73 |
9.44 - 13.58 |
3.9606 times |
Fri 03 October 2025 |
9.59 (-3.52%) |
10.00 |
9.49 - 10.00 |
0.2799 times |

Monthly price and charts RichardsonElectronics Strong monthly Stock price targets for RichardsonElectronics RELL are 10.36 and 11.08 | Monthly Target 1 | 9.81 | | Monthly Target 2 | 10.19 | | Monthly Target 3 | 10.533333333333 | | Monthly Target 4 | 10.91 | | Monthly Target 5 | 11.25 |
Monthly price and volumes Richardson Electronics
| Date |
Closing |
Open |
Range |
Volume |
Fri 05 December 2025 |
10.56 (0.96%) |
10.22 |
10.16 - 10.88 |
0.2222 times |
Fri 28 November 2025 |
10.46 (-2.97%) |
10.67 |
9.37 - 11.07 |
0.8752 times |
Fri 31 October 2025 |
10.78 (10.11%) |
9.67 |
9.44 - 13.58 |
2.9209 times |
Tue 30 September 2025 |
9.79 (-0.41%) |
9.70 |
9.44 - 10.52 |
0.4969 times |
Fri 29 August 2025 |
9.83 (-2.48%) |
9.97 |
9.40 - 10.21 |
0.7382 times |
Thu 31 July 2025 |
10.08 (4.46%) |
9.51 |
9.42 - 11.15 |
0.6912 times |
Mon 30 June 2025 |
9.65 (7.82%) |
8.95 |
8.66 - 9.80 |
0.7372 times |
Fri 30 May 2025 |
8.95 (3.35%) |
8.67 |
8.58 - 9.62 |
0.7004 times |
Wed 30 April 2025 |
8.66 (-22.4%) |
11.08 |
7.57 - 11.26 |
1.7259 times |
Mon 31 March 2025 |
11.16 (-15.45%) |
13.20 |
10.55 - 13.29 |
0.8921 times |
Fri 28 February 2025 |
13.20 (0%) |
12.99 |
12.85 - 13.60 |
0.7938 times |

DMA SMA EMA moving averages of Richardson Electronics RELL
DMA (daily moving average) of Richardson Electronics RELL
| DMA period | DMA value | | 5 day DMA | 10.59 | | 12 day DMA | 10.24 | | 20 day DMA | 10.3 | | 35 day DMA | 10.53 | | 50 day DMA | 10.52 | | 100 day DMA | 10.21 | | 150 day DMA | 9.91 | | 200 day DMA | 10.12 | EMA (exponential moving average) of Richardson Electronics RELL
| EMA period | EMA current | EMA prev | EMA prev2 | | 5 day EMA | 10.57 | 10.57 | 10.52 | | 12 day EMA | 10.43 | 10.41 | 10.37 | | 20 day EMA | 10.41 | 10.39 | 10.36 | | 35 day EMA | 10.41 | 10.4 | 10.38 | | 50 day EMA | 10.5 | 10.5 | 10.49 |
SMA (simple moving average) of Richardson Electronics RELL
| SMA period | SMA current | SMA prev | SMA prev2 | | 5 day SMA | 10.59 | 10.57 | 10.54 | | 12 day SMA | 10.24 | 10.19 | 10.15 | | 20 day SMA | 10.3 | 10.29 | 10.3 | | 35 day SMA | 10.53 | 10.55 | 10.58 | | 50 day SMA | 10.52 | 10.51 | 10.5 | | 100 day SMA | 10.21 | 10.2 | 10.19 | | 150 day SMA | 9.91 | 9.9 | 9.89 | | 200 day SMA | 10.12 | 10.13 | 10.15 |
|
|
