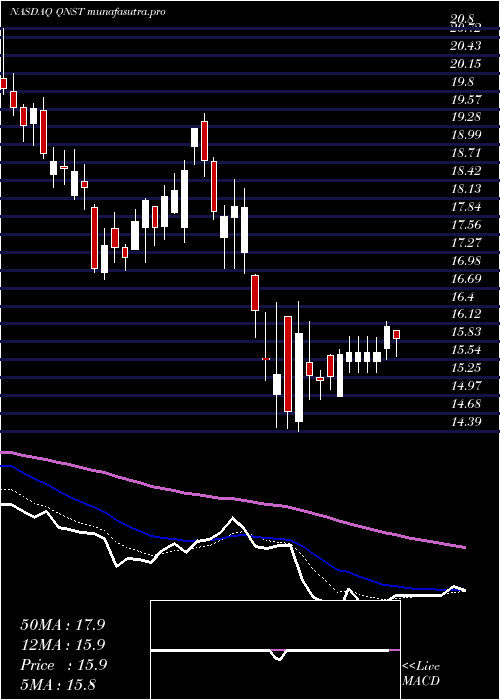
QuinstreetInc QNST full analysis,charts,indicators,moving averages,SMA,DMA,EMA,ADX,MACD,RSIQuinstreet Inc QNST WideScreen charts, DMA,SMA,EMA technical analysis, forecast prediction, by indicators ADX,MACD,RSI,CCI NASDAQ stock exchange
operates under Miscellaneous sector & deals in Business Services
Daily price and charts and targets QuinstreetInc Strong Daily Stock price targets for QuinstreetInc QNST are 14.06 and 14.67 | Daily Target 1 | 13.92 | | Daily Target 2 | 14.2 | | Daily Target 3 | 14.533333333333 | | Daily Target 4 | 14.81 | | Daily Target 5 | 15.14 |
Daily price and volume Quinstreet Inc
| Date |
Closing |
Open |
Range |
Volume |
Fri 05 December 2025 |
14.47 (-2.49%) |
14.75 |
14.26 - 14.87 |
1.0012 times |
Thu 04 December 2025 |
14.84 (-2.11%) |
15.13 |
14.74 - 15.21 |
1.1387 times |
Wed 03 December 2025 |
15.16 (9.78%) |
14.10 |
13.97 - 15.52 |
2.1542 times |
Tue 02 December 2025 |
13.81 (-0.93%) |
14.04 |
13.68 - 14.04 |
0.7139 times |
Mon 01 December 2025 |
13.94 (-0.14%) |
13.75 |
13.75 - 14.11 |
0.5952 times |
Fri 28 November 2025 |
13.96 (-0.21%) |
14.08 |
13.92 - 14.10 |
0.2693 times |
Wed 26 November 2025 |
13.99 (-0.57%) |
13.97 |
13.94 - 14.14 |
0.8423 times |
Tue 25 November 2025 |
14.07 (3.61%) |
13.74 |
13.61 - 14.20 |
1.2927 times |
Mon 24 November 2025 |
13.58 (-0.37%) |
13.58 |
13.41 - 13.74 |
0.9924 times |
Fri 21 November 2025 |
13.63 (4.44%) |
13.05 |
13.03 - 13.70 |
1.0001 times |
Thu 20 November 2025 |
13.05 (-0.99%) |
13.42 |
12.98 - 13.60 |
0.8713 times |
Weekly price and charts QuinstreetInc Strong weekly Stock price targets for QuinstreetInc QNST are 14.08 and 15.92 | Weekly Target 1 | 12.72 | | Weekly Target 2 | 13.59 | | Weekly Target 3 | 14.556666666667 | | Weekly Target 4 | 15.43 | | Weekly Target 5 | 16.4 |
Weekly price and volumes for Quinstreet Inc
| Date |
Closing |
Open |
Range |
Volume |
Fri 05 December 2025 |
14.47 (3.65%) |
13.75 |
13.68 - 15.52 |
1.3772 times |
Fri 28 November 2025 |
13.96 (2.42%) |
13.58 |
13.41 - 14.20 |
0.8349 times |
Fri 21 November 2025 |
13.63 (-1.59%) |
13.76 |
12.98 - 13.88 |
1.0098 times |
Fri 14 November 2025 |
13.85 (0.51%) |
14.08 |
13.72 - 14.57 |
1.1446 times |
Fri 07 November 2025 |
13.78 (-6.83%) |
14.94 |
13.53 - 15.78 |
1.1965 times |
Fri 31 October 2025 |
14.79 (0%) |
14.64 |
14.54 - 14.90 |
0.1716 times |
Fri 31 October 2025 |
14.79 (-1.33%) |
15.06 |
13.75 - 15.11 |
0.9579 times |
Fri 24 October 2025 |
14.99 (5.56%) |
14.31 |
14.23 - 15.36 |
1.1271 times |
Fri 17 October 2025 |
14.20 (2.38%) |
14.11 |
13.56 - 14.69 |
1.0725 times |
Fri 10 October 2025 |
13.87 (-9.17%) |
15.56 |
13.85 - 15.94 |
1.1079 times |
Fri 03 October 2025 |
15.27 (-5.57%) |
16.20 |
15.17 - 16.20 |
0.9213 times |

Monthly price and charts QuinstreetInc Strong monthly Stock price targets for QuinstreetInc QNST are 14.08 and 15.92 | Monthly Target 1 | 12.72 | | Monthly Target 2 | 13.59 | | Monthly Target 3 | 14.556666666667 | | Monthly Target 4 | 15.43 | | Monthly Target 5 | 16.4 |
Monthly price and volumes Quinstreet Inc
| Date |
Closing |
Open |
Range |
Volume |
Fri 05 December 2025 |
14.47 (3.65%) |
13.75 |
13.68 - 15.52 |
0.311 times |
Fri 28 November 2025 |
13.96 (-5.61%) |
14.94 |
12.98 - 15.78 |
0.9453 times |
Fri 31 October 2025 |
14.79 (-4.4%) |
15.31 |
13.56 - 15.94 |
1.1204 times |
Tue 30 September 2025 |
15.47 (-1.34%) |
15.44 |
15.07 - 17.11 |
0.9442 times |
Fri 29 August 2025 |
15.68 (-4.45%) |
16.19 |
14.27 - 17.12 |
1.1967 times |
Thu 31 July 2025 |
16.41 (1.93%) |
16.11 |
15.02 - 16.91 |
0.9463 times |
Mon 30 June 2025 |
16.10 (5.44%) |
15.22 |
14.96 - 16.28 |
0.8135 times |
Fri 30 May 2025 |
15.27 (-12.84%) |
17.85 |
14.69 - 19.29 |
1.7889 times |
Wed 30 April 2025 |
17.52 (-1.79%) |
17.83 |
14.39 - 18.43 |
1.0558 times |
Mon 31 March 2025 |
17.84 (-8.89%) |
19.54 |
16.83 - 19.75 |
0.8779 times |
Fri 28 February 2025 |
19.58 (-17.24%) |
22.91 |
18.98 - 25.50 |
1.0565 times |

DMA SMA EMA moving averages of Quinstreet Inc QNST
DMA (daily moving average) of Quinstreet Inc QNST
| DMA period | DMA value | | 5 day DMA | 14.44 | | 12 day DMA | 13.97 | | 20 day DMA | 13.97 | | 35 day DMA | 14.24 | | 50 day DMA | 14.46 | | 100 day DMA | 15.15 | | 150 day DMA | 15.38 | | 200 day DMA | 15.92 | EMA (exponential moving average) of Quinstreet Inc QNST
| EMA period | EMA current | EMA prev | EMA prev2 | | 5 day EMA | 14.47 | 14.47 | 14.29 | | 12 day EMA | 14.22 | 14.17 | 14.05 | | 20 day EMA | 14.18 | 14.15 | 14.08 | | 35 day EMA | 14.34 | 14.33 | 14.3 | | 50 day EMA | 14.62 | 14.63 | 14.62 |
SMA (simple moving average) of Quinstreet Inc QNST
| SMA period | SMA current | SMA prev | SMA prev2 | | 5 day SMA | 14.44 | 14.34 | 14.17 | | 12 day SMA | 13.97 | 13.89 | 13.78 | | 20 day SMA | 13.97 | 13.94 | 13.94 | | 35 day SMA | 14.24 | 14.23 | 14.22 | | 50 day SMA | 14.46 | 14.49 | 14.52 | | 100 day SMA | 15.15 | 15.16 | 15.17 | | 150 day SMA | 15.38 | 15.41 | 15.43 | | 200 day SMA | 15.92 | 15.96 | 16 |
|
|
