QuantumCorp QMCO full analysis,charts,indicators,moving averages,SMA,DMA,EMA,ADX,MACD,RSIQuantum Corp QMCO WideScreen charts, DMA,SMA,EMA technical analysis, forecast prediction, by indicators ADX,MACD,RSI,CCI NASDAQ stock exchange
Daily price and charts and targets QuantumCorp Strong Daily Stock price targets for QuantumCorp QMCO are 8.63 and 8.89 | Daily Target 1 | 8.42 | | Daily Target 2 | 8.57 | | Daily Target 3 | 8.6833333333333 | | Daily Target 4 | 8.83 | | Daily Target 5 | 8.94 |
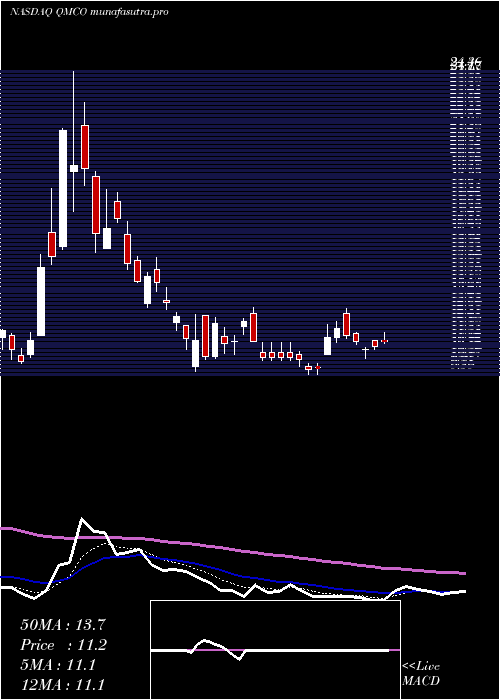
Daily price and volume Quantum Corp
| Date |
Closing |
Open |
Range |
Volume |
Mon 14 July 2025 |
8.71 (0.69%) |
8.65 |
8.54 - 8.80 |
0.5016 times |
Fri 11 July 2025 |
8.65 (-4%) |
8.90 |
8.55 - 9.04 |
0.6873 times |
Thu 10 July 2025 |
9.01 (1.58%) |
9.05 |
8.93 - 9.29 |
0.8968 times |
Wed 09 July 2025 |
8.87 (-2.21%) |
9.07 |
8.84 - 9.27 |
0.6224 times |
Tue 08 July 2025 |
9.07 (1.8%) |
8.97 |
8.97 - 9.49 |
0.706 times |
Mon 07 July 2025 |
8.91 (-1.66%) |
8.91 |
8.60 - 8.99 |
0.6679 times |
Thu 03 July 2025 |
9.06 (-1.31%) |
9.00 |
8.91 - 9.21 |
0.6314 times |
Wed 02 July 2025 |
9.18 (2.34%) |
9.05 |
8.81 - 9.20 |
0.864 times |
Tue 01 July 2025 |
8.97 (-10.03%) |
8.67 |
8.60 - 9.17 |
1.7624 times |
Mon 30 June 2025 |
9.97 (10.29%) |
9.20 |
9.07 - 10.04 |
2.6602 times |
Fri 27 June 2025 |
9.04 (-0.55%) |
9.38 |
8.85 - 9.57 |
1.1894 times |
Weekly price and charts QuantumCorp Strong weekly Stock price targets for QuantumCorp QMCO are 8.63 and 8.89 | Weekly Target 1 | 8.42 | | Weekly Target 2 | 8.57 | | Weekly Target 3 | 8.6833333333333 | | Weekly Target 4 | 8.83 | | Weekly Target 5 | 8.94 |
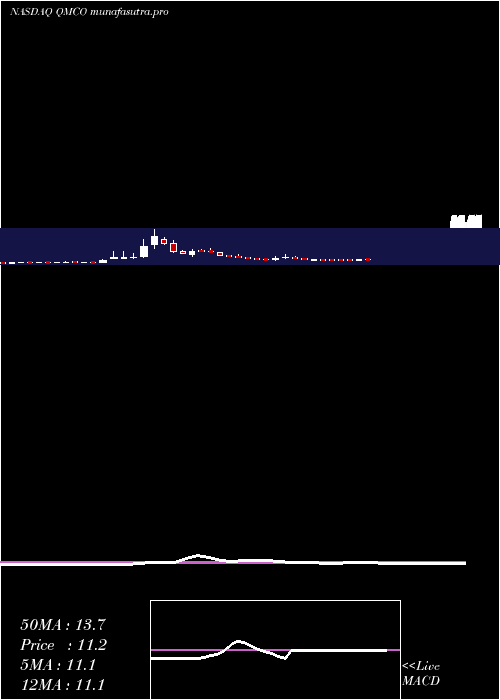
Weekly price and volumes for Quantum Corp
| Date |
Closing |
Open |
Range |
Volume |
Mon 14 July 2025 |
8.71 (0.69%) |
8.65 |
8.54 - 8.80 |
0.0538 times |
Fri 11 July 2025 |
8.65 (-4.53%) |
8.91 |
8.55 - 9.49 |
0.3842 times |
Thu 03 July 2025 |
9.06 (0.22%) |
9.20 |
8.60 - 10.04 |
0.635 times |
Fri 27 June 2025 |
9.04 (7.24%) |
8.06 |
7.25 - 9.57 |
0.6472 times |
Fri 20 June 2025 |
8.43 (-15.19%) |
10.62 |
8.21 - 10.69 |
0.5457 times |
Fri 13 June 2025 |
9.94 (-6.49%) |
11.22 |
9.81 - 11.84 |
1.2067 times |
Fri 06 June 2025 |
10.63 (-10.45%) |
11.77 |
9.93 - 12.53 |
0.8784 times |
Fri 30 May 2025 |
11.87 (0%) |
12.47 |
11.68 - 14.29 |
1.5439 times |
Fri 23 May 2025 |
11.87 (8.5%) |
10.71 |
10.42 - 14.40 |
3.3949 times |
Fri 16 May 2025 |
10.94 (1.3%) |
11.30 |
10.10 - 11.86 |
0.7102 times |
Fri 09 May 2025 |
10.80 (-3.49%) |
11.12 |
10.45 - 11.73 |
0.4227 times |
Monthly price and charts QuantumCorp Strong monthly Stock price targets for QuantumCorp QMCO are 8.63 and 9.58 | Monthly Target 1 | 7.96 | | Monthly Target 2 | 8.34 | | Monthly Target 3 | 8.9133333333333 | | Monthly Target 4 | 9.29 | | Monthly Target 5 | 9.86 |
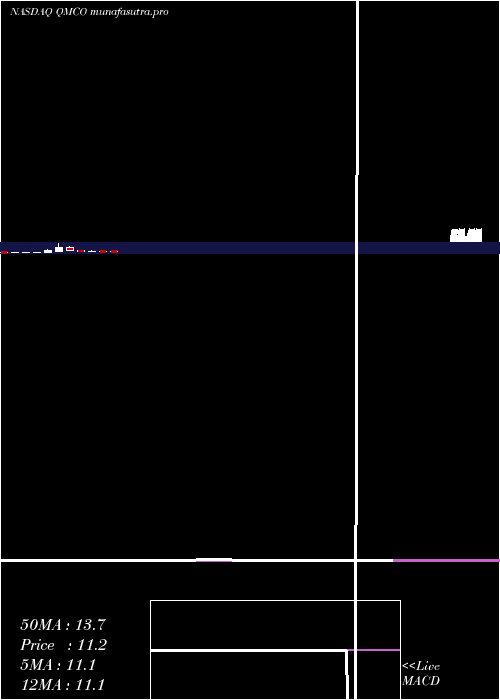
Monthly price and volumes Quantum Corp
| Date |
Closing |
Open |
Range |
Volume |
Mon 14 July 2025 |
8.71 (-12.64%) |
8.67 |
8.54 - 9.49 |
0.1869 times |
Mon 30 June 2025 |
9.97 (-16.01%) |
11.77 |
7.25 - 12.53 |
0.8455 times |
Fri 30 May 2025 |
11.87 (9.91%) |
11.26 |
10.10 - 14.40 |
1.4659 times |
Wed 30 April 2025 |
10.80 (-24.9%) |
14.73 |
9.59 - 15.30 |
0.2883 times |
Mon 31 March 2025 |
14.38 (21.97%) |
11.88 |
10.11 - 24.40 |
1.0128 times |
Fri 28 February 2025 |
11.79 (-47.37%) |
21.05 |
11.21 - 25.46 |
0.5701 times |
Fri 31 January 2025 |
22.40 (-58.46%) |
54.44 |
19.31 - 60.88 |
1.0351 times |
Tue 31 December 2024 |
53.92 (212.94%) |
17.00 |
14.92 - 90.64 |
2.0134 times |
Tue 26 November 2024 |
17.23 (299.77%) |
4.57 |
2.88 - 33.00 |
2.5573 times |
Thu 31 October 2024 |
4.31 (23.14%) |
3.47 |
3.22 - 5.85 |
0.0248 times |
Mon 30 September 2024 |
3.50 (13.64%) |
3.01 |
2.22 - 3.78 |
0.0206 times |
DMA SMA EMA moving averages of Quantum Corp QMCO
DMA (daily moving average) of Quantum Corp QMCO
| DMA period | DMA value | | 5 day DMA | 8.86 | | 12 day DMA | 9.04 | | 20 day DMA | 9.12 | | 35 day DMA | 10.25 | | 50 day DMA | 10.56 | | 100 day DMA | 11.78 | | 150 day DMA | 18.51 | | 200 day DMA | 14.97 | EMA (exponential moving average) of Quantum Corp QMCO
| EMA period | EMA current | EMA prev | EMA prev2 | | 5 day EMA | 8.82 | 8.88 | 9 | | 12 day EMA | 9.03 | 9.09 | 9.17 | | 20 day EMA | 9.33 | 9.39 | 9.47 | | 35 day EMA | 9.81 | 9.88 | 9.95 | | 50 day EMA | 10.44 | 10.51 | 10.59 |
SMA (simple moving average) of Quantum Corp QMCO
| SMA period | SMA current | SMA prev | SMA prev2 | | 5 day SMA | 8.86 | 8.9 | 8.98 | | 12 day SMA | 9.04 | 9.04 | 9.05 | | 20 day SMA | 9.12 | 9.24 | 9.33 | | 35 day SMA | 10.25 | 10.36 | 10.51 | | 50 day SMA | 10.56 | 10.61 | 10.66 | | 100 day SMA | 11.78 | 11.87 | 11.98 | | 150 day SMA | 18.51 | 18.59 | 18.6 | | 200 day SMA | 14.97 | 14.95 | 14.92 |
|
|
