PaypalHoldings PYPL full analysis,charts,indicators,moving averages,SMA,DMA,EMA,ADX,MACD,RSIPaypal Holdings PYPL WideScreen charts, DMA,SMA,EMA technical analysis, forecast prediction, by indicators ADX,MACD,RSI,CCI NASDAQ stock exchange
operates under Miscellaneous sector & deals in Business Services
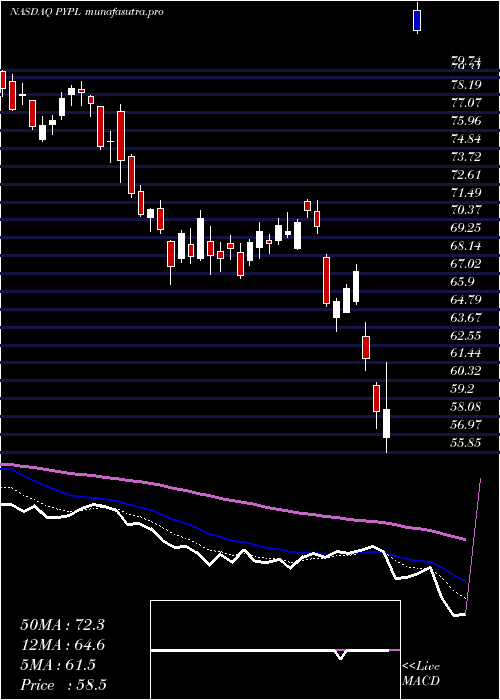
Daily price and charts and targets PaypalHoldings Strong Daily Stock price targets for PaypalHoldings PYPL are 61.87 and 63.33 | Daily Target 1 | 60.76 | | Daily Target 2 | 61.51 | | Daily Target 3 | 62.223333333333 | | Daily Target 4 | 62.97 | | Daily Target 5 | 63.68 |
Daily price and volume Paypal Holdings
| Date |
Closing |
Open |
Range |
Volume |
Fri 05 December 2025 |
62.25 (0.84%) |
61.82 |
61.48 - 62.94 |
0.6493 times |
Thu 04 December 2025 |
61.73 (0.8%) |
60.93 |
60.39 - 62.10 |
0.9165 times |
Wed 03 December 2025 |
61.24 (-2.59%) |
62.85 |
60.41 - 63.93 |
2.2337 times |
Tue 02 December 2025 |
62.87 (0.46%) |
62.80 |
62.15 - 63.84 |
0.5778 times |
Mon 01 December 2025 |
62.58 (-0.18%) |
62.05 |
61.83 - 63.21 |
0.9995 times |
Fri 28 November 2025 |
62.69 (1.39%) |
62.23 |
62.13 - 63.06 |
0.7209 times |
Wed 26 November 2025 |
61.83 (1%) |
61.76 |
61.17 - 62.16 |
0.4523 times |
Tue 25 November 2025 |
61.22 (1.09%) |
60.39 |
60.17 - 61.98 |
0.6527 times |
Mon 24 November 2025 |
60.56 (-0.02%) |
61.40 |
59.85 - 61.43 |
0.8913 times |
Fri 21 November 2025 |
60.57 (4.23%) |
58.24 |
58.04 - 60.96 |
1.9061 times |
Thu 20 November 2025 |
58.11 (-3.33%) |
60.58 |
58.00 - 60.72 |
1.9276 times |
Weekly price and charts PaypalHoldings Strong weekly Stock price targets for PaypalHoldings PYPL are 61.32 and 64.86 | Weekly Target 1 | 58.65 | | Weekly Target 2 | 60.45 | | Weekly Target 3 | 62.19 | | Weekly Target 4 | 63.99 | | Weekly Target 5 | 65.73 |
Weekly price and volumes for Paypal Holdings
| Date |
Closing |
Open |
Range |
Volume |
Fri 05 December 2025 |
62.25 (-0.7%) |
62.05 |
60.39 - 63.93 |
0.8565 times |
Fri 28 November 2025 |
62.69 (3.5%) |
61.40 |
59.85 - 63.06 |
0.4328 times |
Fri 21 November 2025 |
60.57 (-3.57%) |
62.81 |
58.00 - 63.17 |
1.4423 times |
Fri 14 November 2025 |
62.81 (-5.15%) |
67.06 |
62.75 - 67.99 |
0.8128 times |
Fri 07 November 2025 |
66.22 (-4.4%) |
67.23 |
64.78 - 68.21 |
0.6465 times |
Fri 31 October 2025 |
69.27 (0%) |
68.27 |
67.62 - 69.58 |
0.2679 times |
Fri 31 October 2025 |
69.27 (-0.7%) |
70.86 |
67.62 - 79.22 |
2.6078 times |
Fri 24 October 2025 |
69.76 (3.27%) |
67.98 |
67.56 - 71.25 |
0.4683 times |
Fri 17 October 2025 |
67.55 (-3.28%) |
70.72 |
64.51 - 70.93 |
0.9965 times |
Fri 10 October 2025 |
69.84 (1.07%) |
69.80 |
69.45 - 77.34 |
1.4686 times |
Fri 03 October 2025 |
69.10 (2.67%) |
67.96 |
66.22 - 71.26 |
1.2639 times |
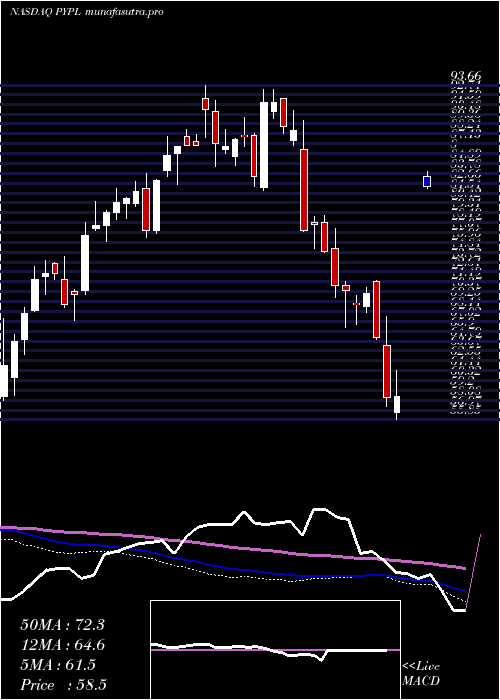
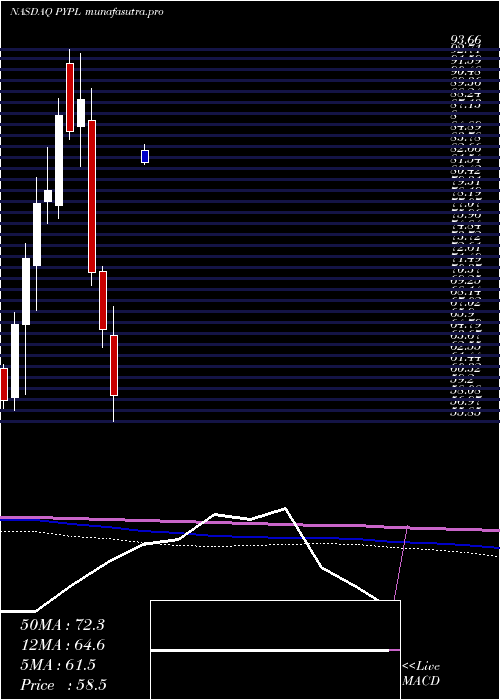
Monthly price and charts PaypalHoldings Strong monthly Stock price targets for PaypalHoldings PYPL are 61.32 and 64.86 | Monthly Target 1 | 58.65 | | Monthly Target 2 | 60.45 | | Monthly Target 3 | 62.19 | | Monthly Target 4 | 63.99 | | Monthly Target 5 | 65.73 |
Monthly price and volumes Paypal Holdings
| Date |
Closing |
Open |
Range |
Volume |
Fri 05 December 2025 |
62.25 (-0.7%) |
62.05 |
60.39 - 63.93 |
0.2546 times |
Fri 28 November 2025 |
62.69 (-9.5%) |
67.23 |
58.00 - 68.21 |
0.9912 times |
Fri 31 October 2025 |
69.27 (3.3%) |
66.90 |
64.51 - 79.22 |
1.8862 times |
Tue 30 September 2025 |
67.06 (-4.46%) |
68.92 |
65.24 - 71.26 |
1.1697 times |
Fri 29 August 2025 |
70.19 (2.08%) |
68.00 |
66.57 - 70.73 |
0.8419 times |
Thu 31 July 2025 |
68.76 (-7.48%) |
73.95 |
68.46 - 79.50 |
1.117 times |
Mon 30 June 2025 |
74.32 (5.75%) |
69.28 |
67.52 - 75.31 |
0.8166 times |
Fri 30 May 2025 |
70.28 (6.74%) |
65.62 |
64.85 - 74.15 |
0.8125 times |
Wed 30 April 2025 |
65.84 (0.9%) |
64.62 |
55.85 - 67.57 |
1.1304 times |
Mon 31 March 2025 |
65.25 (-8.16%) |
71.10 |
63.40 - 71.66 |
0.9797 times |
Fri 28 February 2025 |
71.05 (-19.79%) |
86.50 |
69.68 - 89.71 |
1.3024 times |
DMA SMA EMA moving averages of Paypal Holdings PYPL
DMA (daily moving average) of Paypal Holdings PYPL
| DMA period | DMA value | | 5 day DMA | 62.13 | | 12 day DMA | 61.31 | | 20 day DMA | 62.68 | | 35 day DMA | 65.36 | | 50 day DMA | 66.74 | | 100 day DMA | 68.25 | | 150 day DMA | 69.61 | | 200 day DMA | 68.8 | EMA (exponential moving average) of Paypal Holdings PYPL
| EMA period | EMA current | EMA prev | EMA prev2 | | 5 day EMA | 61.99 | 61.86 | 61.93 | | 12 day EMA | 62.2 | 62.19 | 62.27 | | 20 day EMA | 63 | 63.08 | 63.22 | | 35 day EMA | 64.48 | 64.61 | 64.78 | | 50 day EMA | 66.35 | 66.52 | 66.72 |
SMA (simple moving average) of Paypal Holdings PYPL
| SMA period | SMA current | SMA prev | SMA prev2 | | 5 day SMA | 62.13 | 62.22 | 62.24 | | 12 day SMA | 61.31 | 61.19 | 61.2 | | 20 day SMA | 62.68 | 62.88 | 63.2 | | 35 day SMA | 65.36 | 65.47 | 65.64 | | 50 day SMA | 66.74 | 66.83 | 66.96 | | 100 day SMA | 68.25 | 68.36 | 68.47 | | 150 day SMA | 69.61 | 69.63 | 69.66 | | 200 day SMA | 68.8 | 68.88 | 68.96 |
|
|
