InvescoDwa PXI full analysis,charts,indicators,moving averages,SMA,DMA,EMA,ADX,MACD,RSIInvesco Dwa PXI WideScreen charts, DMA,SMA,EMA technical analysis, forecast prediction, by indicators ADX,MACD,RSI,CCI NASDAQ stock exchange
operates under N A sector & deals in N A
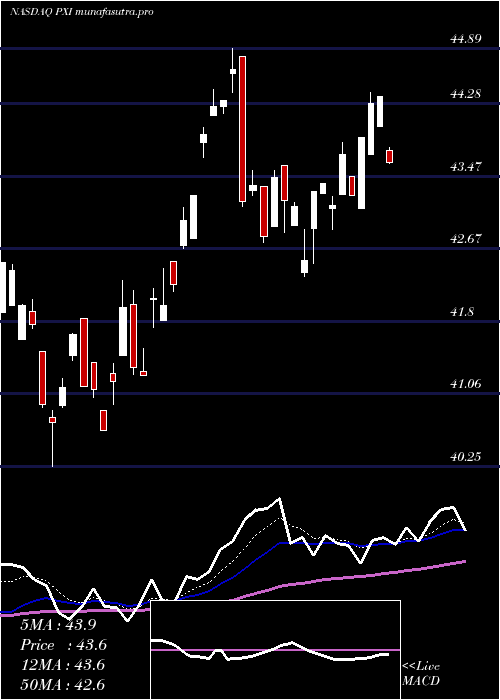
Daily price and charts and targets InvescoDwa Strong Daily Stock price targets for InvescoDwa PXI are 43.81 and 44.22 | Daily Target 1 | 43.46 | | Daily Target 2 | 43.74 | | Daily Target 3 | 43.873333333333 | | Daily Target 4 | 44.15 | | Daily Target 5 | 44.28 |
Daily price and volume Invesco Dwa
| Date |
Closing |
Open |
Range |
Volume |
Tue 29 July 2025 |
44.01 (0.64%) |
43.86 |
43.60 - 44.01 |
0.7456 times |
Mon 28 July 2025 |
43.73 (1.27%) |
43.60 |
43.45 - 43.73 |
0.8241 times |
Fri 25 July 2025 |
43.18 (-0.64%) |
43.26 |
43.12 - 43.32 |
0.4709 times |
Thu 24 July 2025 |
43.46 (0.39%) |
43.45 |
43.36 - 43.48 |
0.5887 times |
Wed 23 July 2025 |
43.29 (1.43%) |
42.78 |
42.78 - 43.29 |
1.4912 times |
Tue 22 July 2025 |
42.68 (0.4%) |
42.47 |
42.47 - 42.79 |
2.0799 times |
Mon 21 July 2025 |
42.51 (-3.25%) |
43.94 |
42.51 - 43.94 |
0.7849 times |
Fri 18 July 2025 |
43.94 (0.78%) |
43.88 |
43.85 - 43.94 |
1.0207 times |
Thu 17 July 2025 |
43.60 (1%) |
43.20 |
43.20 - 43.65 |
1.5623 times |
Wed 16 July 2025 |
43.17 (-1.03%) |
43.17 |
43.07 - 43.36 |
0.4317 times |
Tue 15 July 2025 |
43.62 (-1.65%) |
43.75 |
43.61 - 43.79 |
1.3343 times |
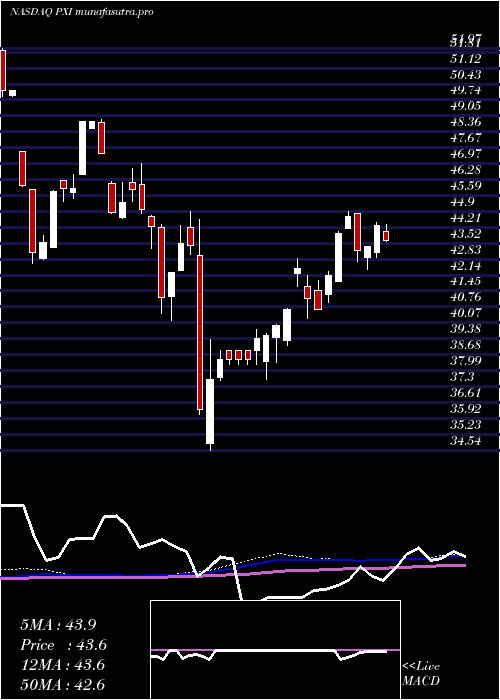
Weekly price and charts InvescoDwa Strong weekly Stock price targets for InvescoDwa PXI are 43.73 and 44.29 | Weekly Target 1 | 43.26 | | Weekly Target 2 | 43.64 | | Weekly Target 3 | 43.823333333333 | | Weekly Target 4 | 44.2 | | Weekly Target 5 | 44.38 |
Weekly price and volumes for Invesco Dwa
| Date |
Closing |
Open |
Range |
Volume |
Tue 29 July 2025 |
44.01 (1.92%) |
43.60 |
43.45 - 44.01 |
0.2022 times |
Fri 25 July 2025 |
43.18 (-1.73%) |
43.94 |
42.47 - 43.94 |
0.6977 times |
Fri 18 July 2025 |
43.94 (-0.77%) |
44.02 |
43.07 - 44.35 |
0.626 times |
Fri 11 July 2025 |
44.28 (2.05%) |
43.11 |
42.88 - 44.40 |
0.4803 times |
Thu 03 July 2025 |
43.39 (0.44%) |
42.92 |
42.36 - 43.39 |
0.3944 times |
Fri 27 June 2025 |
43.20 (-3.27%) |
44.80 |
42.73 - 44.80 |
1.4764 times |
Fri 20 June 2025 |
44.66 (1.66%) |
44.14 |
44.14 - 44.89 |
0.3236 times |
Fri 13 June 2025 |
43.93 (4.32%) |
41.87 |
41.87 - 44.01 |
0.9708 times |
Fri 06 June 2025 |
42.11 (3.62%) |
41.28 |
40.93 - 42.31 |
1.0062 times |
Fri 30 May 2025 |
40.64 (-1.17%) |
41.48 |
40.64 - 41.89 |
3.8224 times |
Fri 23 May 2025 |
41.12 (-3.06%) |
41.66 |
40.25 - 42.10 |
1.0517 times |
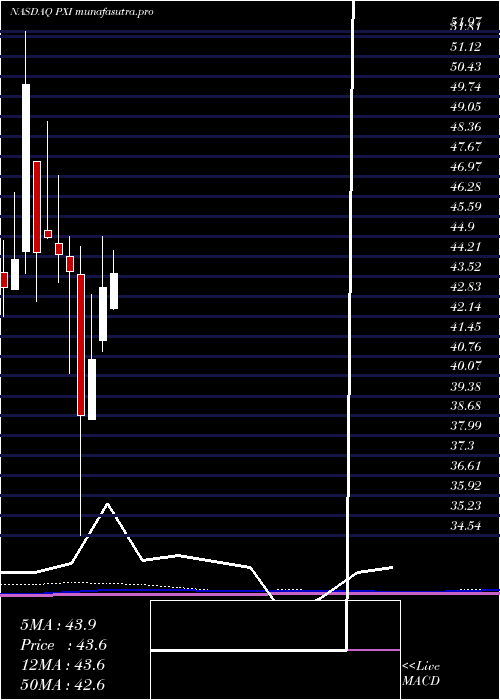
Monthly price and charts InvescoDwa Strong monthly Stock price targets for InvescoDwa PXI are 43.19 and 45.23 | Monthly Target 1 | 41.55 | | Monthly Target 2 | 42.78 | | Monthly Target 3 | 43.59 | | Monthly Target 4 | 44.82 | | Monthly Target 5 | 45.63 |
Monthly price and volumes Invesco Dwa
| Date |
Closing |
Open |
Range |
Volume |
Tue 29 July 2025 |
44.01 (2.04%) |
42.40 |
42.36 - 44.40 |
0.3953 times |
Mon 30 June 2025 |
43.13 (6.13%) |
41.28 |
40.93 - 44.89 |
0.6712 times |
Fri 30 May 2025 |
40.64 (5.01%) |
38.55 |
38.55 - 42.87 |
2.3908 times |
Wed 30 April 2025 |
38.70 (-11.4%) |
43.59 |
34.54 - 44.56 |
0.9351 times |
Mon 31 March 2025 |
43.68 (-1.31%) |
44.19 |
40.16 - 44.88 |
0.6275 times |
Fri 28 February 2025 |
44.26 (-1.32%) |
44.64 |
43.31 - 46.99 |
0.563 times |
Fri 31 January 2025 |
44.85 (1.13%) |
45.09 |
44.81 - 48.88 |
1.3503 times |
Tue 31 December 2024 |
44.35 (-11.57%) |
47.48 |
42.63 - 47.48 |
1.0314 times |
Tue 26 November 2024 |
50.15 (13.69%) |
44.36 |
43.61 - 51.97 |
0.7821 times |
Thu 31 October 2024 |
44.11 (2.25%) |
43.05 |
43.05 - 46.42 |
1.2534 times |
Mon 30 September 2024 |
43.14 (-5.68%) |
45.09 |
40.32 - 45.09 |
1.0492 times |
DMA SMA EMA moving averages of Invesco Dwa PXI
DMA (daily moving average) of Invesco Dwa PXI
| DMA period | DMA value | | 5 day DMA | 43.53 | | 12 day DMA | 43.46 | | 20 day DMA | 43.45 | | 35 day DMA | 43.37 | | 50 day DMA | 42.8 | | 100 day DMA | 41.59 | | 150 day DMA | 42.92 | | 200 day DMA | 43.77 | EMA (exponential moving average) of Invesco Dwa PXI
| EMA period | EMA current | EMA prev | EMA prev2 | | 5 day EMA | 43.6 | 43.4 | 43.24 | | 12 day EMA | 43.48 | 43.38 | 43.32 | | 20 day EMA | 43.4 | 43.34 | 43.3 | | 35 day EMA | 43.08 | 43.02 | 42.98 | | 50 day EMA | 42.77 | 42.72 | 42.68 |
SMA (simple moving average) of Invesco Dwa PXI
| SMA period | SMA current | SMA prev | SMA prev2 | | 5 day SMA | 43.53 | 43.27 | 43.02 | | 12 day SMA | 43.46 | 43.48 | 43.5 | | 20 day SMA | 43.45 | 43.41 | 43.38 | | 35 day SMA | 43.37 | 43.29 | 43.22 | | 50 day SMA | 42.8 | 42.77 | 42.75 | | 100 day SMA | 41.59 | 41.57 | 41.56 | | 150 day SMA | 42.92 | 42.91 | 42.9 | | 200 day SMA | 43.77 | 43.77 | 43.77 |
|
|
