PerformanceShipping PSHG full analysis,charts,indicators,moving averages,SMA,DMA,EMA,ADX,MACD,RSIPerformance Shipping PSHG WideScreen charts, DMA,SMA,EMA technical analysis, forecast prediction, by indicators ADX,MACD,RSI,CCI NASDAQ stock exchange
Daily price and charts and targets PerformanceShipping Strong Daily Stock price targets for PerformanceShipping PSHG are 1.8 and 1.88 | Daily Target 1 | 1.77 | | Daily Target 2 | 1.82 | | Daily Target 3 | 1.8533333333333 | | Daily Target 4 | 1.9 | | Daily Target 5 | 1.93 |
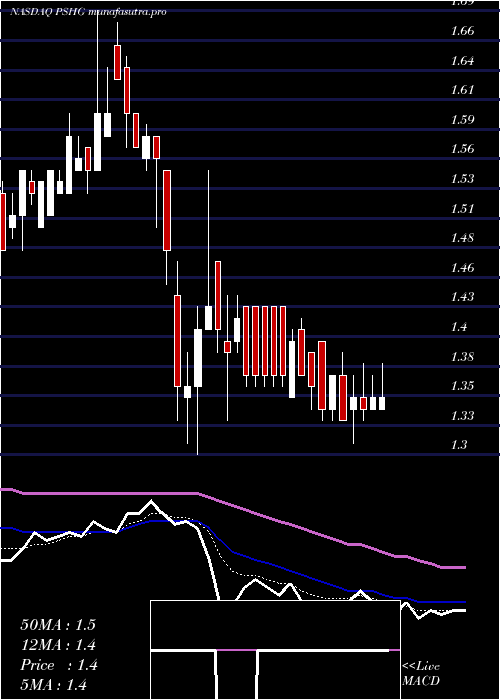
Daily price and volume Performance Shipping
| Date |
Closing |
Open |
Range |
Volume |
Mon 14 July 2025 |
1.86 (-1.06%) |
1.89 |
1.81 - 1.89 |
1.3126 times |
Fri 11 July 2025 |
1.88 (0.53%) |
1.89 |
1.83 - 1.92 |
1.3603 times |
Thu 10 July 2025 |
1.87 (6.86%) |
1.76 |
1.76 - 1.87 |
1.5896 times |
Wed 09 July 2025 |
1.75 (-1.13%) |
1.77 |
1.75 - 1.79 |
0.3467 times |
Tue 08 July 2025 |
1.77 (1.14%) |
1.73 |
1.70 - 1.78 |
0.8054 times |
Mon 07 July 2025 |
1.75 (4.17%) |
1.71 |
1.68 - 1.75 |
0.7075 times |
Thu 03 July 2025 |
1.68 (-2.33%) |
1.73 |
1.68 - 1.73 |
0.5875 times |
Wed 02 July 2025 |
1.72 (1.18%) |
1.71 |
1.67 - 1.72 |
0.8901 times |
Tue 01 July 2025 |
1.70 (-2.86%) |
1.75 |
1.68 - 1.75 |
1.5199 times |
Mon 30 June 2025 |
1.75 (-1.69%) |
1.80 |
1.73 - 1.80 |
0.8804 times |
Fri 27 June 2025 |
1.78 (-1.66%) |
1.81 |
1.75 - 1.82 |
0.524 times |
Weekly price and charts PerformanceShipping Strong weekly Stock price targets for PerformanceShipping PSHG are 1.8 and 1.88 | Weekly Target 1 | 1.77 | | Weekly Target 2 | 1.82 | | Weekly Target 3 | 1.8533333333333 | | Weekly Target 4 | 1.9 | | Weekly Target 5 | 1.93 |
Weekly price and volumes for Performance Shipping
| Date |
Closing |
Open |
Range |
Volume |
Mon 14 July 2025 |
1.86 (-1.06%) |
1.89 |
1.81 - 1.89 |
0.3037 times |
Fri 11 July 2025 |
1.88 (11.9%) |
1.71 |
1.68 - 1.92 |
1.1128 times |
Thu 03 July 2025 |
1.68 (-5.62%) |
1.80 |
1.67 - 1.80 |
0.8972 times |
Fri 27 June 2025 |
1.78 (-8.25%) |
2.02 |
1.75 - 2.02 |
1.2934 times |
Fri 20 June 2025 |
1.94 (5.43%) |
2.02 |
1.78 - 2.34 |
3.0724 times |
Fri 13 June 2025 |
1.84 (12.88%) |
1.68 |
1.63 - 1.87 |
0.9389 times |
Fri 06 June 2025 |
1.63 (-6.32%) |
1.74 |
1.58 - 1.74 |
0.627 times |
Fri 30 May 2025 |
1.74 (18.37%) |
1.53 |
1.52 - 1.77 |
0.6013 times |
Fri 23 May 2025 |
1.47 (4.26%) |
1.44 |
1.41 - 1.54 |
0.3817 times |
Fri 16 May 2025 |
1.41 (-11.32%) |
1.58 |
1.40 - 1.64 |
0.7717 times |
Fri 09 May 2025 |
1.59 (17.78%) |
1.35 |
1.35 - 1.66 |
0.5897 times |

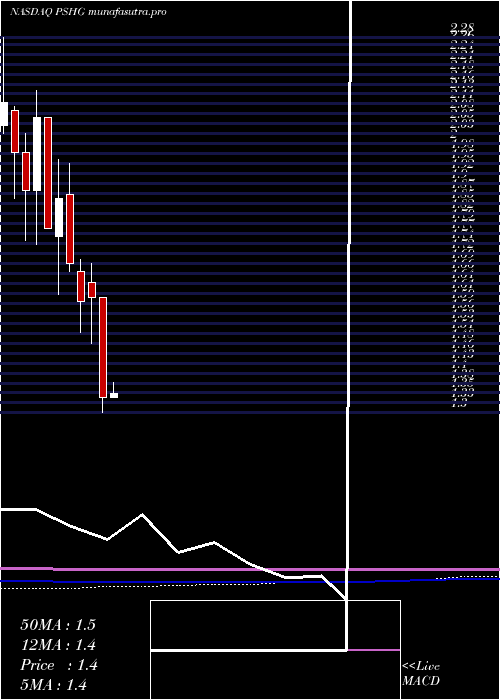
Monthly price and charts PerformanceShipping Strong monthly Stock price targets for PerformanceShipping PSHG are 1.77 and 2.02 | Monthly Target 1 | 1.57 | | Monthly Target 2 | 1.71 | | Monthly Target 3 | 1.8166666666667 | | Monthly Target 4 | 1.96 | | Monthly Target 5 | 2.07 |
Monthly price and volumes Performance Shipping
| Date |
Closing |
Open |
Range |
Volume |
Mon 14 July 2025 |
1.86 (6.29%) |
1.75 |
1.67 - 1.92 |
0.7881 times |
Mon 30 June 2025 |
1.75 (0.57%) |
1.74 |
1.58 - 2.34 |
2.2916 times |
Fri 30 May 2025 |
1.74 (29.85%) |
1.34 |
1.34 - 1.77 |
0.8854 times |
Wed 30 April 2025 |
1.34 (-16.25%) |
1.60 |
1.30 - 1.60 |
0.8308 times |
Mon 31 March 2025 |
1.60 (0.63%) |
1.64 |
1.48 - 1.69 |
0.4488 times |
Fri 28 February 2025 |
1.59 (-5.92%) |
1.67 |
1.51 - 1.70 |
1.0487 times |
Fri 31 January 2025 |
1.69 (-9.14%) |
1.87 |
1.67 - 1.95 |
1.0977 times |
Tue 31 December 2024 |
1.86 (4.49%) |
1.76 |
1.61 - 1.96 |
0.8347 times |
Tue 26 November 2024 |
1.78 (-14.01%) |
2.07 |
1.78 - 2.07 |
0.6481 times |
Thu 31 October 2024 |
2.07 (10.11%) |
1.88 |
1.74 - 2.14 |
1.1263 times |
Mon 30 September 2024 |
1.88 (-5.05%) |
1.98 |
1.75 - 2.03 |
0.6393 times |
DMA SMA EMA moving averages of Performance Shipping PSHG
DMA (daily moving average) of Performance Shipping PSHG
| DMA period | DMA value | | 5 day DMA | 1.83 | | 12 day DMA | 1.78 | | 20 day DMA | 1.82 | | 35 day DMA | 1.74 | | 50 day DMA | 1.66 | | 100 day DMA | 1.58 | | 150 day DMA | 1.63 | | 200 day DMA | 1.71 | EMA (exponential moving average) of Performance Shipping PSHG
| EMA period | EMA current | EMA prev | EMA prev2 | | 5 day EMA | 1.83 | 1.82 | 1.79 | | 12 day EMA | 1.81 | 1.8 | 1.78 | | 20 day EMA | 1.77 | 1.76 | 1.75 | | 35 day EMA | 1.72 | 1.71 | 1.7 | | 50 day EMA | 1.66 | 1.65 | 1.64 |
SMA (simple moving average) of Performance Shipping PSHG
| SMA period | SMA current | SMA prev | SMA prev2 | | 5 day SMA | 1.83 | 1.8 | 1.76 | | 12 day SMA | 1.78 | 1.78 | 1.77 | | 20 day SMA | 1.82 | 1.81 | 1.8 | | 35 day SMA | 1.74 | 1.72 | 1.71 | | 50 day SMA | 1.66 | 1.65 | 1.64 | | 100 day SMA | 1.58 | 1.58 | 1.57 | | 150 day SMA | 1.63 | 1.63 | 1.63 | | 200 day SMA | 1.71 | 1.71 | 1.71 |
|
|
