InvescoS PSCD full analysis,charts,indicators,moving averages,SMA,DMA,EMA,ADX,MACD,RSIInvesco S PSCD WideScreen charts, DMA,SMA,EMA technical analysis, forecast prediction, by indicators ADX,MACD,RSI,CCI NASDAQ stock exchange
operates under N A sector & deals in N A
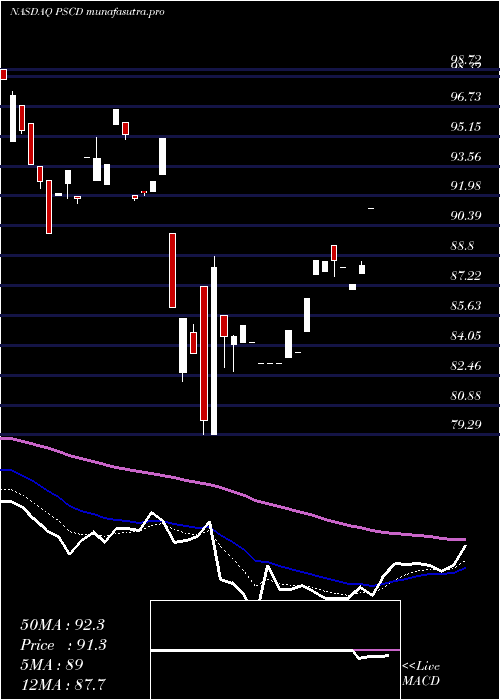
Daily price and charts and targets InvescoS Strong Daily Stock price targets for InvescoS PSCD are 105.38 and 105.72 | Daily Target 1 | 105.32 | | Daily Target 2 | 105.44 | | Daily Target 3 | 105.66333333333 | | Daily Target 4 | 105.78 | | Daily Target 5 | 106 |
Daily price and volume Invesco S
| Date |
Closing |
Open |
Range |
Volume |
Fri 05 December 2025 |
105.55 (0.29%) |
105.89 |
105.55 - 105.89 |
0.7246 times |
Thu 04 December 2025 |
105.25 (-1.32%) |
106.41 |
105.25 - 106.41 |
1.1594 times |
Wed 03 December 2025 |
106.66 (0.86%) |
106.66 |
106.66 - 106.66 |
0.1449 times |
Tue 02 December 2025 |
105.75 (-0.29%) |
105.75 |
105.75 - 105.75 |
0.1449 times |
Mon 01 December 2025 |
106.06 (0.13%) |
104.55 |
104.55 - 106.75 |
0.7246 times |
Fri 28 November 2025 |
105.92 (-0.26%) |
105.92 |
105.92 - 105.92 |
0.1449 times |
Wed 26 November 2025 |
106.20 (1.4%) |
107.18 |
106.20 - 107.18 |
0.8696 times |
Tue 25 November 2025 |
104.73 (4.1%) |
104.89 |
104.73 - 105.11 |
1.0145 times |
Mon 24 November 2025 |
100.61 (0.23%) |
100.77 |
100.61 - 100.77 |
0.5797 times |
Fri 21 November 2025 |
100.38 (4.74%) |
98.92 |
98.92 - 100.82 |
4.4928 times |
Thu 20 November 2025 |
95.84 (-1.3%) |
98.33 |
95.84 - 98.33 |
0.2899 times |
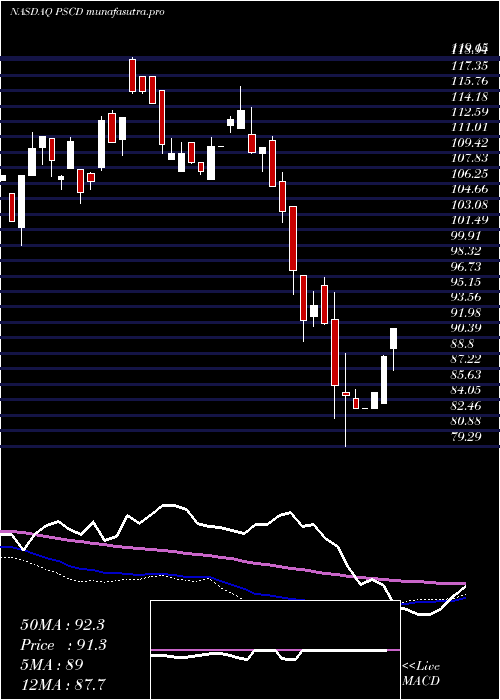
Weekly price and charts InvescoS Strong weekly Stock price targets for InvescoS PSCD are 105.05 and 107.25 | Weekly Target 1 | 103.42 | | Weekly Target 2 | 104.48 | | Weekly Target 3 | 105.61666666667 | | Weekly Target 4 | 106.68 | | Weekly Target 5 | 107.82 |
Weekly price and volumes for Invesco S
| Date |
Closing |
Open |
Range |
Volume |
Fri 05 December 2025 |
105.55 (-0.35%) |
104.55 |
104.55 - 106.75 |
0.7299 times |
Fri 28 November 2025 |
105.92 (5.52%) |
100.77 |
100.61 - 107.18 |
0.6569 times |
Fri 21 November 2025 |
100.38 (1.02%) |
97.08 |
95.84 - 100.82 |
1.4964 times |
Fri 14 November 2025 |
99.37 (-0.74%) |
100.12 |
99.10 - 101.63 |
1.3504 times |
Fri 07 November 2025 |
100.11 (-2.42%) |
99.99 |
98.85 - 102.38 |
1.2044 times |
Fri 31 October 2025 |
102.59 (0%) |
102.59 |
102.59 - 102.59 |
0.1095 times |
Fri 31 October 2025 |
102.59 (-8.33%) |
113.03 |
102.59 - 113.03 |
2.4453 times |
Fri 24 October 2025 |
111.91 (3.23%) |
109.80 |
109.20 - 112.75 |
0.3285 times |
Fri 17 October 2025 |
108.41 (4.61%) |
105.25 |
105.25 - 109.52 |
0.6204 times |
Fri 10 October 2025 |
103.63 (-8.61%) |
112.43 |
103.63 - 112.43 |
1.0584 times |
Fri 03 October 2025 |
113.39 (1.64%) |
112.53 |
110.77 - 113.66 |
0.4766 times |
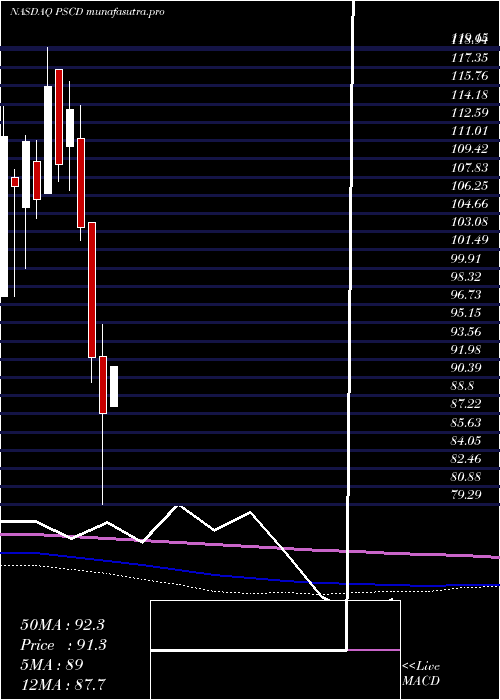
Monthly price and charts InvescoS Strong monthly Stock price targets for InvescoS PSCD are 105.05 and 107.25 | Monthly Target 1 | 103.42 | | Monthly Target 2 | 104.48 | | Monthly Target 3 | 105.61666666667 | | Monthly Target 4 | 106.68 | | Monthly Target 5 | 107.82 |
Monthly price and volumes Invesco S
| Date |
Closing |
Open |
Range |
Volume |
Fri 05 December 2025 |
105.55 (-0.35%) |
104.55 |
104.55 - 106.75 |
0.1317 times |
Fri 28 November 2025 |
105.92 (3.25%) |
99.99 |
95.84 - 107.18 |
0.8494 times |
Fri 31 October 2025 |
102.59 (-8.02%) |
112.16 |
102.59 - 113.66 |
0.8564 times |
Tue 30 September 2025 |
111.53 (-0.45%) |
111.44 |
109.90 - 115.93 |
0.5004 times |
Fri 29 August 2025 |
112.03 (11.41%) |
99.49 |
99.49 - 114.19 |
1.0008 times |
Thu 31 July 2025 |
100.56 (-0.1%) |
104.43 |
100.56 - 107.46 |
0.4151 times |
Mon 30 June 2025 |
100.66 (2.32%) |
98.03 |
97.37 - 101.99 |
0.9218 times |
Fri 30 May 2025 |
98.38 (12.74%) |
87.86 |
87.86 - 100.66 |
1.1523 times |
Wed 30 April 2025 |
87.26 (-5.31%) |
92.23 |
79.29 - 95.02 |
2.1731 times |
Mon 31 March 2025 |
92.15 (-10.88%) |
103.91 |
89.99 - 103.91 |
1.9991 times |
Fri 28 February 2025 |
103.40 (-9.04%) |
111.21 |
102.28 - 114.03 |
1.6856 times |
DMA SMA EMA moving averages of Invesco S PSCD
DMA (daily moving average) of Invesco S PSCD
| DMA period | DMA value | | 5 day DMA | 105.85 | | 12 day DMA | 103.34 | | 20 day DMA | 101.84 | | 35 day DMA | 104 | | 50 day DMA | 105.65 | | 100 day DMA | 107.46 | | 150 day DMA | 104.73 | | 200 day DMA | 101.82 | EMA (exponential moving average) of Invesco S PSCD
| EMA period | EMA current | EMA prev | EMA prev2 | | 5 day EMA | 105.47 | 105.43 | 105.52 | | 12 day EMA | 104.17 | 103.92 | 103.68 | | 20 day EMA | 103.71 | 103.52 | 103.34 | | 35 day EMA | 104.59 | 104.53 | 104.49 | | 50 day EMA | 106.12 | 106.14 | 106.18 |
SMA (simple moving average) of Invesco S PSCD
| SMA period | SMA current | SMA prev | SMA prev2 | | 5 day SMA | 105.85 | 105.93 | 106.12 | | 12 day SMA | 103.34 | 102.65 | 101.95 | | 20 day SMA | 101.84 | 101.51 | 101.35 | | 35 day SMA | 104 | 104.08 | 104.18 | | 50 day SMA | 105.65 | 105.74 | 105.86 | | 100 day SMA | 107.46 | 107.43 | 107.43 | | 150 day SMA | 104.73 | 104.6 | 104.49 | | 200 day SMA | 101.82 | 101.84 | 101.87 |
|
|
