US PRTS full analysis,charts,indicators,moving averages,SMA,DMA,EMA,ADX,MACD,RSIU S PRTS WideScreen charts, DMA,SMA,EMA technical analysis, forecast prediction, by indicators ADX,MACD,RSI,CCI NASDAQ stock exchange
operates under Consumer Services sector & deals in Other Specialty Stores
Daily price and charts and targets US Strong Daily Stock price targets for US PRTS are 0.78 and 0.8 | Daily Target 1 | 0.77 | | Daily Target 2 | 0.78 | | Daily Target 3 | 0.79 | | Daily Target 4 | 0.8 | | Daily Target 5 | 0.81 |
Daily price and volume U S
| Date |
Closing |
Open |
Range |
Volume |
Mon 14 July 2025 |
0.79 (1.28%) |
0.79 |
0.78 - 0.80 |
1.1472 times |
Fri 11 July 2025 |
0.78 (0%) |
0.78 |
0.78 - 0.80 |
1.6604 times |
Thu 10 July 2025 |
0.78 (0%) |
0.78 |
0.76 - 0.78 |
0.7013 times |
Wed 09 July 2025 |
0.78 (1.3%) |
0.77 |
0.76 - 0.78 |
0.4195 times |
Tue 08 July 2025 |
0.77 (0%) |
0.78 |
0.77 - 0.79 |
1.0148 times |
Mon 07 July 2025 |
0.77 (1.32%) |
0.78 |
0.76 - 0.78 |
1.036 times |
Thu 03 July 2025 |
0.76 (-1.3%) |
0.77 |
0.75 - 0.77 |
0.2358 times |
Wed 02 July 2025 |
0.77 (2.67%) |
0.77 |
0.74 - 0.77 |
1.1954 times |
Tue 01 July 2025 |
0.75 (1.35%) |
0.74 |
0.74 - 0.78 |
1.5198 times |
Mon 30 June 2025 |
0.74 (-1.33%) |
0.75 |
0.74 - 0.79 |
1.0699 times |
Fri 27 June 2025 |
0.75 (-3.85%) |
0.78 |
0.75 - 0.79 |
1.6083 times |
Weekly price and charts US Strong weekly Stock price targets for US PRTS are 0.78 and 0.8 | Weekly Target 1 | 0.77 | | Weekly Target 2 | 0.78 | | Weekly Target 3 | 0.79 | | Weekly Target 4 | 0.8 | | Weekly Target 5 | 0.81 |
Weekly price and volumes for U S
| Date |
Closing |
Open |
Range |
Volume |
Mon 14 July 2025 |
0.79 (1.28%) |
0.79 |
0.78 - 0.80 |
0.1267 times |
Fri 11 July 2025 |
0.78 (2.63%) |
0.78 |
0.76 - 0.80 |
0.5334 times |
Thu 03 July 2025 |
0.76 (1.33%) |
0.75 |
0.74 - 0.79 |
0.4439 times |
Fri 27 June 2025 |
0.75 (-5.06%) |
0.79 |
0.70 - 0.81 |
1.2272 times |
Fri 20 June 2025 |
0.79 (-2.47%) |
0.80 |
0.76 - 0.83 |
0.6198 times |
Fri 13 June 2025 |
0.81 (-11.96%) |
0.92 |
0.80 - 0.95 |
1.0384 times |
Fri 06 June 2025 |
0.92 (4.55%) |
0.88 |
0.85 - 0.94 |
0.5621 times |
Fri 30 May 2025 |
0.88 (4.76%) |
0.85 |
0.85 - 0.94 |
0.6073 times |
Fri 23 May 2025 |
0.84 (6.33%) |
0.80 |
0.79 - 0.90 |
1.2417 times |
Fri 16 May 2025 |
0.79 (-2.47%) |
0.82 |
0.75 - 0.94 |
3.5996 times |
Fri 09 May 2025 |
0.81 (-6.9%) |
0.86 |
0.80 - 0.89 |
1.023 times |

Monthly price and charts US Strong monthly Stock price targets for US PRTS are 0.77 and 0.83 | Monthly Target 1 | 0.72 | | Monthly Target 2 | 0.75 | | Monthly Target 3 | 0.77666666666667 | | Monthly Target 4 | 0.81 | | Monthly Target 5 | 0.84 |
Monthly price and volumes U S
| Date |
Closing |
Open |
Range |
Volume |
Mon 14 July 2025 |
0.79 (6.76%) |
0.74 |
0.74 - 0.80 |
0.2141 times |
Mon 30 June 2025 |
0.74 (-15.91%) |
0.88 |
0.70 - 0.95 |
0.7745 times |
Fri 30 May 2025 |
0.88 (-4.35%) |
0.91 |
0.75 - 0.96 |
1.5001 times |
Wed 30 April 2025 |
0.92 (-8%) |
0.99 |
0.76 - 1.05 |
0.9171 times |
Mon 31 March 2025 |
1.00 (3.09%) |
0.95 |
0.85 - 1.33 |
2.0998 times |
Fri 28 February 2025 |
0.97 (-16.38%) |
1.13 |
0.91 - 1.23 |
0.7379 times |
Fri 31 January 2025 |
1.16 (7.41%) |
1.08 |
1.00 - 1.42 |
1.2047 times |
Tue 31 December 2024 |
1.08 (0.93%) |
0.97 |
0.90 - 1.08 |
0.4751 times |
Tue 26 November 2024 |
1.07 (28.92%) |
0.82 |
0.79 - 1.18 |
1.0154 times |
Thu 31 October 2024 |
0.83 (-8.79%) |
0.91 |
0.68 - 0.93 |
1.0613 times |
Mon 30 September 2024 |
0.91 (13.75%) |
0.80 |
0.76 - 0.95 |
1.0136 times |

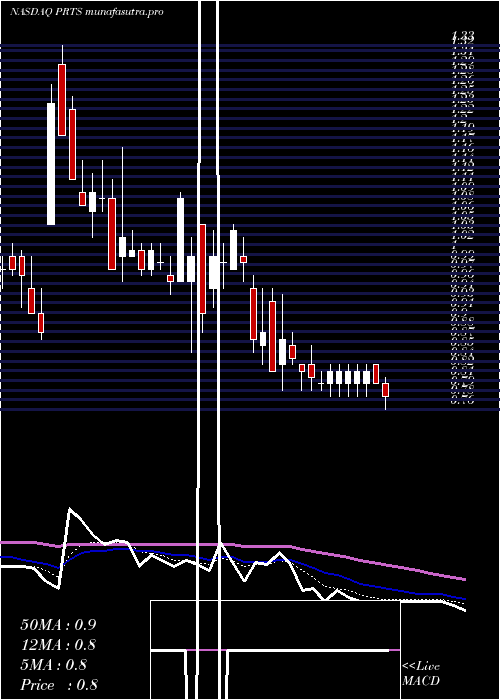
DMA SMA EMA moving averages of U S PRTS
DMA (daily moving average) of U S PRTS
| DMA period | DMA value | | 5 day DMA | 0.78 | | 12 day DMA | 0.77 | | 20 day DMA | 0.78 | | 35 day DMA | 0.82 | | 50 day DMA | 0.83 | | 100 day DMA | 0.89 | | 150 day DMA | 0.96 | | 200 day DMA | 0.94 | EMA (exponential moving average) of U S PRTS
| EMA period | EMA current | EMA prev | EMA prev2 | | 5 day EMA | 0.78 | 0.77 | 0.77 | | 12 day EMA | 0.78 | 0.78 | 0.78 | | 20 day EMA | 0.8 | 0.8 | 0.8 | | 35 day EMA | 0.82 | 0.82 | 0.82 | | 50 day EMA | 0.84 | 0.84 | 0.84 |
SMA (simple moving average) of U S PRTS
| SMA period | SMA current | SMA prev | SMA prev2 | | 5 day SMA | 0.78 | 0.78 | 0.77 | | 12 day SMA | 0.77 | 0.76 | 0.76 | | 20 day SMA | 0.78 | 0.78 | 0.79 | | 35 day SMA | 0.82 | 0.82 | 0.83 | | 50 day SMA | 0.83 | 0.83 | 0.84 | | 100 day SMA | 0.89 | 0.89 | 0.89 | | 150 day SMA | 0.96 | 0.96 | 0.96 | | 200 day SMA | 0.94 | 0.94 | 0.94 |
|
|
