ProvidentFinancial PROV full analysis,charts,indicators,moving averages,SMA,DMA,EMA,ADX,MACD,RSIProvident Financial PROV WideScreen charts, DMA,SMA,EMA technical analysis, forecast prediction, by indicators ADX,MACD,RSI,CCI NASDAQ stock exchange
operates under Finance sector & deals in Savings Institutions
Daily price and charts and targets ProvidentFinancial Strong Daily Stock price targets for ProvidentFinancial PROV are 15.48 and 16.02 | Daily Target 1 | 15.05 | | Daily Target 2 | 15.37 | | Daily Target 3 | 15.586666666667 | | Daily Target 4 | 15.91 | | Daily Target 5 | 16.13 |
Daily price and volume Provident Financial
| Date |
Closing |
Open |
Range |
Volume |
Fri 11 July 2025 |
15.70 (-1.26%) |
15.26 |
15.26 - 15.80 |
0.9372 times |
Thu 10 July 2025 |
15.90 (1.47%) |
15.62 |
15.53 - 15.90 |
0.4499 times |
Wed 09 July 2025 |
15.67 (0.71%) |
15.48 |
15.25 - 15.69 |
0.1218 times |
Tue 08 July 2025 |
15.56 (0%) |
15.68 |
15.45 - 15.70 |
0.9747 times |
Mon 07 July 2025 |
15.56 (-0.32%) |
15.50 |
15.21 - 15.70 |
2.268 times |
Thu 03 July 2025 |
15.61 (-0.26%) |
15.61 |
15.47 - 15.80 |
2.2587 times |
Wed 02 July 2025 |
15.65 (-0.45%) |
15.65 |
15.50 - 15.89 |
0.2249 times |
Tue 01 July 2025 |
15.72 (1.42%) |
15.69 |
15.39 - 15.90 |
0.1874 times |
Mon 30 June 2025 |
15.50 (-1.4%) |
15.89 |
15.40 - 15.89 |
1.9494 times |
Fri 27 June 2025 |
15.72 (1.42%) |
15.73 |
15.23 - 15.75 |
0.6279 times |
Thu 26 June 2025 |
15.50 (0.52%) |
15.42 |
15.22 - 15.55 |
0.5717 times |
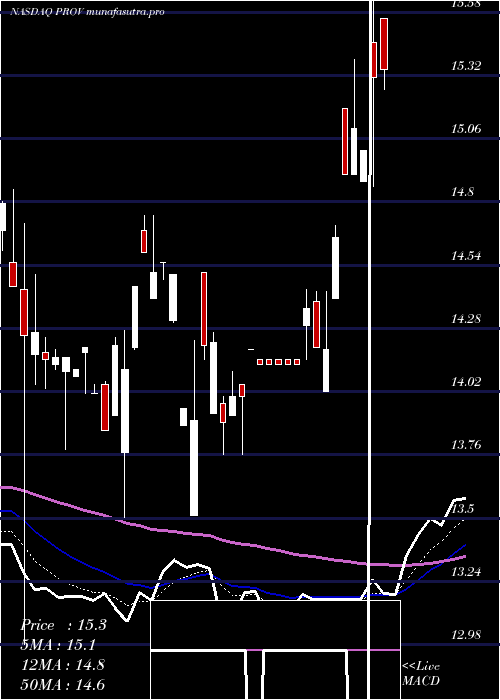
Weekly price and charts ProvidentFinancial Strong weekly Stock price targets for ProvidentFinancial PROV are 15.46 and 16.15 | Weekly Target 1 | 14.91 | | Weekly Target 2 | 15.31 | | Weekly Target 3 | 15.603333333333 | | Weekly Target 4 | 16 | | Weekly Target 5 | 16.29 |
Weekly price and volumes for Provident Financial
| Date |
Closing |
Open |
Range |
Volume |
Fri 11 July 2025 |
15.70 (0.58%) |
15.50 |
15.21 - 15.90 |
1.9032 times |
Thu 03 July 2025 |
15.61 (-0.7%) |
15.89 |
15.39 - 15.90 |
1.8506 times |
Fri 27 June 2025 |
15.72 (1.95%) |
15.36 |
15.01 - 15.83 |
0.7245 times |
Fri 20 June 2025 |
15.42 (0.13%) |
15.53 |
15.39 - 15.53 |
0.2215 times |
Fri 13 June 2025 |
15.40 (-3.27%) |
15.90 |
15.05 - 15.98 |
0.9009 times |
Fri 06 June 2025 |
15.92 (3.24%) |
15.53 |
15.16 - 15.99 |
1.265 times |
Fri 30 May 2025 |
15.42 (3.07%) |
15.03 |
15.00 - 15.49 |
0.7432 times |
Fri 23 May 2025 |
14.96 (-3.79%) |
15.32 |
14.85 - 15.72 |
0.792 times |
Fri 16 May 2025 |
15.55 (3.32%) |
15.25 |
15.07 - 16.00 |
1.0098 times |
Fri 09 May 2025 |
15.05 (-1.89%) |
15.57 |
14.85 - 15.57 |
0.5893 times |
Fri 02 May 2025 |
15.34 (4.71%) |
15.18 |
14.86 - 15.64 |
0.9159 times |

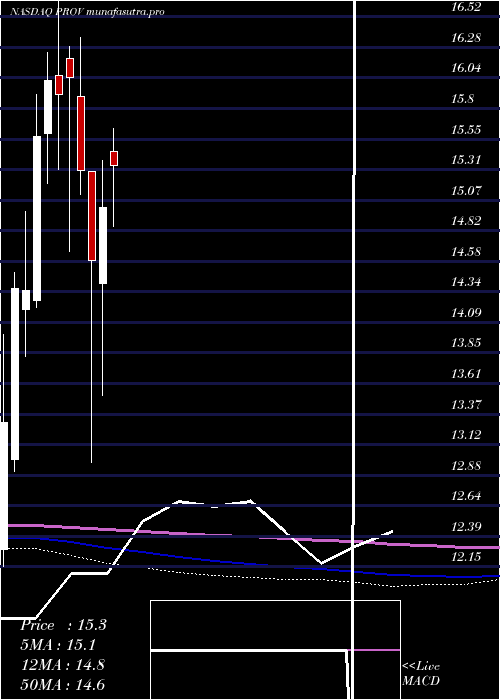
Monthly price and charts ProvidentFinancial Strong monthly Stock price targets for ProvidentFinancial PROV are 15.46 and 16.15 | Monthly Target 1 | 14.91 | | Monthly Target 2 | 15.31 | | Monthly Target 3 | 15.603333333333 | | Monthly Target 4 | 16 | | Monthly Target 5 | 16.29 |
Monthly price and volumes Provident Financial
| Date |
Closing |
Open |
Range |
Volume |
Fri 11 July 2025 |
15.70 (1.29%) |
15.69 |
15.21 - 15.90 |
0.679 times |
Mon 30 June 2025 |
15.50 (0.52%) |
15.53 |
15.01 - 15.99 |
0.889 times |
Fri 30 May 2025 |
15.42 (2.73%) |
15.45 |
14.85 - 16.00 |
0.8856 times |
Wed 30 April 2025 |
15.01 (2.88%) |
14.40 |
13.51 - 15.38 |
0.6487 times |
Mon 31 March 2025 |
14.59 (-4.64%) |
15.29 |
12.98 - 15.29 |
1.1809 times |
Fri 28 February 2025 |
15.30 (-4.61%) |
15.89 |
15.11 - 16.36 |
0.7133 times |
Fri 31 January 2025 |
16.04 (0.82%) |
16.19 |
14.66 - 16.29 |
1.3324 times |
Tue 31 December 2024 |
15.91 (-0.69%) |
16.06 |
15.31 - 16.70 |
1.1034 times |
Tue 26 November 2024 |
16.02 (2.89%) |
15.60 |
15.20 - 16.24 |
1.2586 times |
Thu 31 October 2024 |
15.57 (8.5%) |
14.27 |
14.21 - 15.91 |
1.3091 times |
Mon 30 September 2024 |
14.35 (-0.07%) |
14.20 |
13.82 - 14.98 |
2.4734 times |
DMA SMA EMA moving averages of Provident Financial PROV
DMA (daily moving average) of Provident Financial PROV
| DMA period | DMA value | | 5 day DMA | 15.68 | | 12 day DMA | 15.63 | | 20 day DMA | 15.57 | | 35 day DMA | 15.47 | | 50 day DMA | 15.38 | | 100 day DMA | 14.99 | | 150 day DMA | 15.27 | | 200 day DMA | 15.21 | EMA (exponential moving average) of Provident Financial PROV
| EMA period | EMA current | EMA prev | EMA prev2 | | 5 day EMA | 15.71 | 15.71 | 15.62 | | 12 day EMA | 15.65 | 15.64 | 15.59 | | 20 day EMA | 15.58 | 15.57 | 15.53 | | 35 day EMA | 15.45 | 15.43 | 15.4 | | 50 day EMA | 15.31 | 15.29 | 15.27 |
SMA (simple moving average) of Provident Financial PROV
| SMA period | SMA current | SMA prev | SMA prev2 | | 5 day SMA | 15.68 | 15.66 | 15.61 | | 12 day SMA | 15.63 | 15.62 | 15.6 | | 20 day SMA | 15.57 | 15.55 | 15.52 | | 35 day SMA | 15.47 | 15.46 | 15.45 | | 50 day SMA | 15.38 | 15.35 | 15.31 | | 100 day SMA | 14.99 | 14.99 | 14.99 | | 150 day SMA | 15.27 | 15.27 | 15.27 | | 200 day SMA | 15.21 | 15.2 | 15.19 |
|
|
