ProgressSoftware PRGS full analysis,charts,indicators,moving averages,SMA,DMA,EMA,ADX,MACD,RSIProgress Software PRGS WideScreen charts, DMA,SMA,EMA technical analysis, forecast prediction, by indicators ADX,MACD,RSI,CCI NASDAQ stock exchange
operates under Technology sector & deals in Computer Software Prepackaged Software
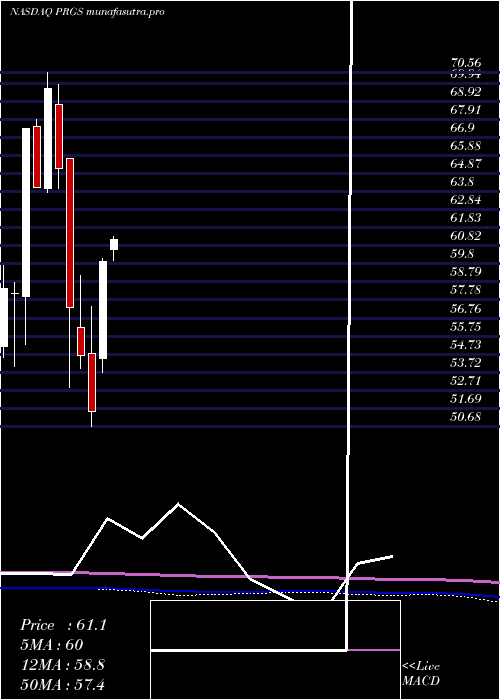
Daily price and charts and targets ProgressSoftware Strong Daily Stock price targets for ProgressSoftware PRGS are 43.4 and 44.09 | Daily Target 1 | 42.89 | | Daily Target 2 | 43.22 | | Daily Target 3 | 43.583333333333 | | Daily Target 4 | 43.91 | | Daily Target 5 | 44.27 |
Daily price and volume Progress Software
| Date |
Closing |
Open |
Range |
Volume |
Fri 05 December 2025 |
43.54 (0.48%) |
43.30 |
43.26 - 43.95 |
0.8443 times |
Thu 04 December 2025 |
43.33 (-0.12%) |
43.38 |
42.98 - 43.75 |
0.7163 times |
Wed 03 December 2025 |
43.38 (1.38%) |
42.66 |
42.47 - 43.60 |
1.3793 times |
Tue 02 December 2025 |
42.79 (2%) |
42.16 |
41.95 - 43.00 |
0.8235 times |
Mon 01 December 2025 |
41.95 (1.3%) |
41.23 |
41.19 - 42.59 |
1.3212 times |
Fri 28 November 2025 |
41.41 (0.49%) |
41.47 |
41.17 - 41.77 |
0.447 times |
Wed 26 November 2025 |
41.21 (-1.08%) |
41.35 |
41.00 - 41.69 |
1.0086 times |
Tue 25 November 2025 |
41.66 (3.97%) |
40.23 |
40.23 - 41.76 |
0.9748 times |
Mon 24 November 2025 |
40.07 (-1.35%) |
40.47 |
39.64 - 40.66 |
1.5708 times |
Fri 21 November 2025 |
40.62 (2.47%) |
39.60 |
39.13 - 41.00 |
0.9143 times |
Thu 20 November 2025 |
39.64 (0.56%) |
39.77 |
39.43 - 40.44 |
1.5899 times |
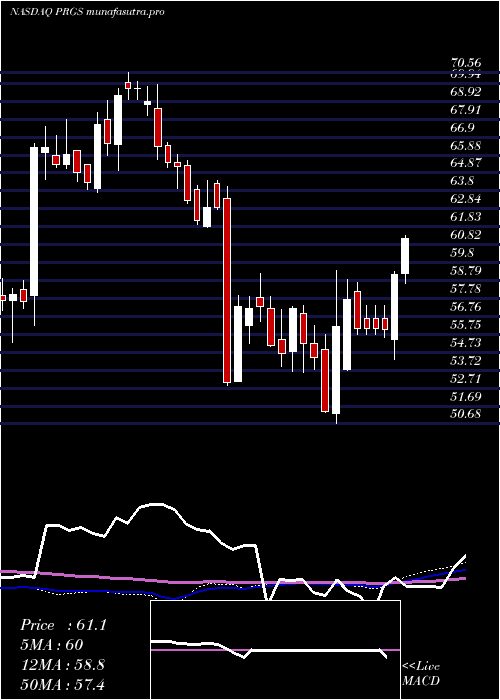
Weekly price and charts ProgressSoftware Strong weekly Stock price targets for ProgressSoftware PRGS are 42.37 and 45.13 | Weekly Target 1 | 40.13 | | Weekly Target 2 | 41.84 | | Weekly Target 3 | 42.893333333333 | | Weekly Target 4 | 44.6 | | Weekly Target 5 | 45.65 |
Weekly price and volumes for Progress Software
| Date |
Closing |
Open |
Range |
Volume |
Fri 05 December 2025 |
43.54 (5.14%) |
41.23 |
41.19 - 43.95 |
0.8979 times |
Fri 28 November 2025 |
41.41 (1.94%) |
40.47 |
39.64 - 41.77 |
0.7065 times |
Fri 21 November 2025 |
40.62 (-3.33%) |
41.63 |
39.00 - 41.63 |
1.2542 times |
Fri 14 November 2025 |
42.02 (-0.64%) |
42.65 |
41.30 - 43.63 |
0.7931 times |
Fri 07 November 2025 |
42.29 (-0.82%) |
42.38 |
41.58 - 43.44 |
0.8891 times |
Fri 31 October 2025 |
42.64 (0%) |
41.87 |
41.36 - 42.83 |
0.2901 times |
Fri 31 October 2025 |
42.64 (-7.32%) |
46.43 |
41.36 - 46.60 |
1.2064 times |
Fri 24 October 2025 |
46.01 (1.88%) |
45.47 |
44.60 - 46.67 |
1.0236 times |
Fri 17 October 2025 |
45.16 (1.14%) |
46.06 |
44.57 - 47.11 |
1.363 times |
Fri 10 October 2025 |
44.65 (-3.29%) |
46.20 |
44.46 - 47.31 |
1.5763 times |
Fri 03 October 2025 |
46.17 (9.88%) |
42.21 |
41.89 - 47.37 |
4.3446 times |
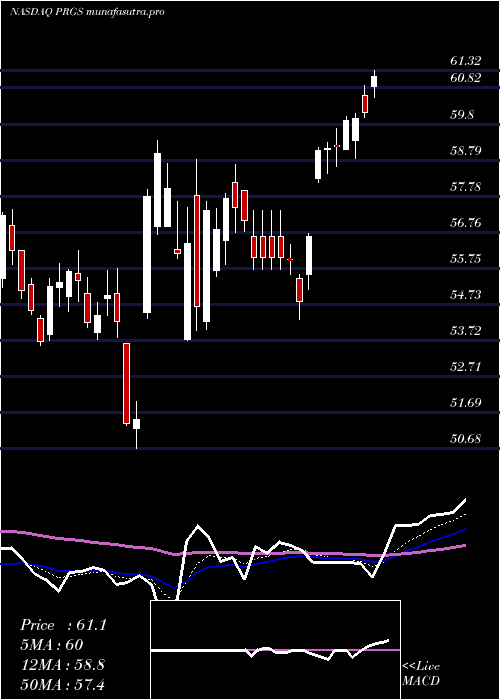
Monthly price and charts ProgressSoftware Strong monthly Stock price targets for ProgressSoftware PRGS are 42.37 and 45.13 | Monthly Target 1 | 40.13 | | Monthly Target 2 | 41.84 | | Monthly Target 3 | 42.893333333333 | | Monthly Target 4 | 44.6 | | Monthly Target 5 | 45.65 |
Monthly price and volumes Progress Software
| Date |
Closing |
Open |
Range |
Volume |
Fri 05 December 2025 |
43.54 (5.14%) |
41.23 |
41.19 - 43.95 |
0.16 times |
Fri 28 November 2025 |
41.41 (-2.88%) |
42.38 |
39.00 - 43.63 |
0.6492 times |
Fri 31 October 2025 |
42.64 (-2.94%) |
43.80 |
41.36 - 47.37 |
1.2707 times |
Tue 30 September 2025 |
43.93 (-5.1%) |
45.63 |
40.29 - 46.70 |
1.5134 times |
Fri 29 August 2025 |
46.29 (-3.72%) |
48.00 |
42.88 - 48.47 |
1.0748 times |
Thu 31 July 2025 |
48.08 (-24.69%) |
60.87 |
47.44 - 60.87 |
2.0518 times |
Mon 30 June 2025 |
63.84 (3.7%) |
61.23 |
60.97 - 65.50 |
0.713 times |
Fri 30 May 2025 |
61.56 (2.67%) |
60.60 |
59.41 - 63.24 |
0.6171 times |
Wed 30 April 2025 |
59.96 (16.4%) |
54.50 |
53.71 - 60.09 |
1.0389 times |
Mon 31 March 2025 |
51.51 (-5.73%) |
54.79 |
50.68 - 57.40 |
0.9111 times |
Fri 28 February 2025 |
54.64 (-4.69%) |
56.24 |
53.91 - 59.17 |
0.8799 times |
DMA SMA EMA moving averages of Progress Software PRGS
DMA (daily moving average) of Progress Software PRGS
| DMA period | DMA value | | 5 day DMA | 43 | | 12 day DMA | 41.59 | | 20 day DMA | 41.69 | | 35 day DMA | 42.72 | | 50 day DMA | 43.51 | | 100 day DMA | 44.32 | | 150 day DMA | 49.58 | | 200 day DMA | 51.22 | EMA (exponential moving average) of Progress Software PRGS
| EMA period | EMA current | EMA prev | EMA prev2 | | 5 day EMA | 42.97 | 42.68 | 42.35 | | 12 day EMA | 42.27 | 42.04 | 41.8 | | 20 day EMA | 42.2 | 42.06 | 41.93 | | 35 day EMA | 42.6 | 42.54 | 42.49 | | 50 day EMA | 43.29 | 43.28 | 43.28 |
SMA (simple moving average) of Progress Software PRGS
| SMA period | SMA current | SMA prev | SMA prev2 | | 5 day SMA | 43 | 42.57 | 42.15 | | 12 day SMA | 41.59 | 41.28 | 40.99 | | 20 day SMA | 41.69 | 41.61 | 41.58 | | 35 day SMA | 42.72 | 42.76 | 42.83 | | 50 day SMA | 43.51 | 43.46 | 43.42 | | 100 day SMA | 44.32 | 44.37 | 44.42 | | 150 day SMA | 49.58 | 49.69 | 49.8 | | 200 day SMA | 51.22 | 51.28 | 51.35 |
|
|
