PowellIndustries POWL full analysis,charts,indicators,moving averages,SMA,DMA,EMA,ADX,MACD,RSIPowell Industries POWL WideScreen charts, DMA,SMA,EMA technical analysis, forecast prediction, by indicators ADX,MACD,RSI,CCI NASDAQ stock exchange
operates under Consumer Durables sector & deals in Electrical Products
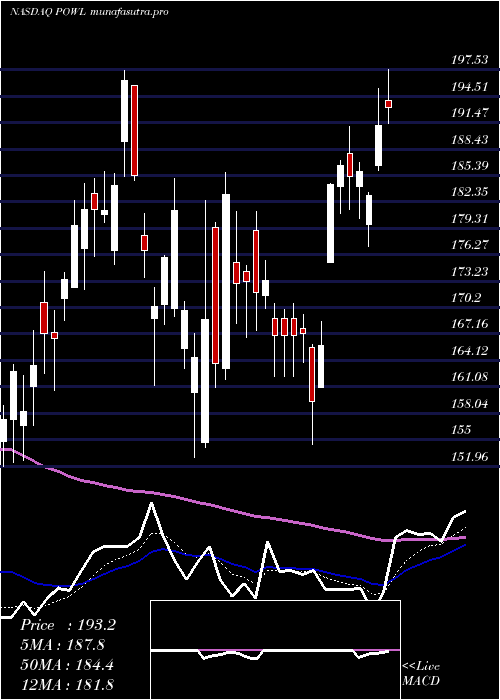
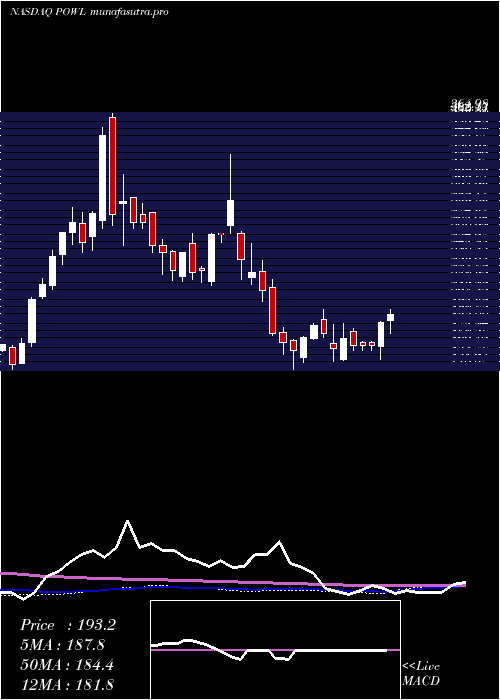
Daily price and charts and targets PowellIndustries Strong Daily Stock price targets for PowellIndustries POWL are 334.29 and 352.23 | Daily Target 1 | 319.71 | | Daily Target 2 | 330.92 | | Daily Target 3 | 337.65 | | Daily Target 4 | 348.86 | | Daily Target 5 | 355.59 |
Daily price and volume Powell Industries
| Date |
Closing |
Open |
Range |
Volume |
Fri 05 December 2025 |
342.13 (1.6%) |
336.83 |
326.44 - 344.38 |
0.7289 times |
Thu 04 December 2025 |
336.75 (4.1%) |
323.48 |
320.00 - 351.16 |
0.5509 times |
Wed 03 December 2025 |
323.48 (0.3%) |
321.43 |
309.25 - 327.04 |
0.8496 times |
Tue 02 December 2025 |
322.50 (0.91%) |
322.52 |
315.70 - 331.78 |
1.3434 times |
Mon 01 December 2025 |
319.58 (-1.13%) |
312.20 |
307.00 - 323.06 |
0.8235 times |
Fri 28 November 2025 |
323.22 (0.44%) |
326.27 |
319.18 - 326.27 |
0.3213 times |
Wed 26 November 2025 |
321.79 (2.96%) |
313.00 |
313.00 - 326.43 |
0.9664 times |
Tue 25 November 2025 |
312.55 (4.16%) |
304.28 |
296.28 - 318.12 |
1.1389 times |
Mon 24 November 2025 |
300.08 (6.39%) |
285.00 |
285.00 - 303.00 |
1.1024 times |
Fri 21 November 2025 |
282.05 (-4.18%) |
292.90 |
277.77 - 295.94 |
2.1748 times |
Thu 20 November 2025 |
294.35 (3.18%) |
295.41 |
292.31 - 313.15 |
2.4897 times |
Weekly price and charts PowellIndustries Strong weekly Stock price targets for PowellIndustries POWL are 324.57 and 368.73 | Weekly Target 1 | 289.27 | | Weekly Target 2 | 315.7 | | Weekly Target 3 | 333.43 | | Weekly Target 4 | 359.86 | | Weekly Target 5 | 377.59 |
Weekly price and volumes for Powell Industries
| Date |
Closing |
Open |
Range |
Volume |
Fri 05 December 2025 |
342.13 (5.85%) |
312.20 |
307.00 - 351.16 |
0.7954 times |
Fri 28 November 2025 |
323.22 (14.6%) |
285.00 |
285.00 - 326.43 |
0.6533 times |
Fri 21 November 2025 |
282.05 (-14.44%) |
329.66 |
277.77 - 342.40 |
1.984 times |
Fri 14 November 2025 |
329.66 (-9.77%) |
378.00 |
306.75 - 385.00 |
0.9597 times |
Fri 07 November 2025 |
365.36 (-4.7%) |
374.17 |
343.30 - 403.01 |
0.7236 times |
Fri 31 October 2025 |
383.39 (0%) |
384.58 |
370.74 - 389.06 |
0.1369 times |
Fri 31 October 2025 |
383.39 (5.04%) |
369.04 |
365.00 - 413.00 |
1.1435 times |
Fri 24 October 2025 |
364.99 (10.37%) |
341.88 |
321.92 - 367.48 |
1.1745 times |
Fri 17 October 2025 |
330.71 (9.85%) |
309.78 |
296.97 - 342.36 |
1.4947 times |
Fri 10 October 2025 |
301.06 (-0.99%) |
310.00 |
298.81 - 326.39 |
0.9344 times |
Fri 03 October 2025 |
304.06 (4.5%) |
295.94 |
293.51 - 322.00 |
0.9473 times |
Monthly price and charts PowellIndustries Strong monthly Stock price targets for PowellIndustries POWL are 324.57 and 368.73 | Monthly Target 1 | 289.27 | | Monthly Target 2 | 315.7 | | Monthly Target 3 | 333.43 | | Monthly Target 4 | 359.86 | | Monthly Target 5 | 377.59 |
Monthly price and volumes Powell Industries
| Date |
Closing |
Open |
Range |
Volume |
Fri 05 December 2025 |
342.13 (5.85%) |
312.20 |
307.00 - 351.16 |
0.1605 times |
Fri 28 November 2025 |
323.22 (-15.69%) |
374.17 |
277.77 - 403.01 |
0.8716 times |
Fri 31 October 2025 |
383.39 (25.78%) |
300.01 |
296.97 - 413.00 |
1.0912 times |
Tue 30 September 2025 |
304.81 (14.52%) |
259.09 |
251.55 - 308.56 |
0.79 times |
Fri 29 August 2025 |
266.16 (12.26%) |
225.15 |
207.00 - 284.00 |
1.1661 times |
Thu 31 July 2025 |
237.10 (12.66%) |
207.20 |
203.46 - 252.01 |
0.998 times |
Mon 30 June 2025 |
210.45 (24.09%) |
169.00 |
164.26 - 221.43 |
1.0239 times |
Fri 30 May 2025 |
169.59 (-7.38%) |
186.55 |
164.63 - 198.19 |
1.2466 times |
Wed 30 April 2025 |
183.11 (7.5%) |
170.55 |
152.89 - 191.00 |
1.0997 times |
Mon 31 March 2025 |
170.33 (0.37%) |
170.91 |
146.02 - 197.50 |
1.5524 times |
Fri 28 February 2025 |
169.71 (-29.22%) |
225.15 |
159.00 - 253.43 |
2.019 times |
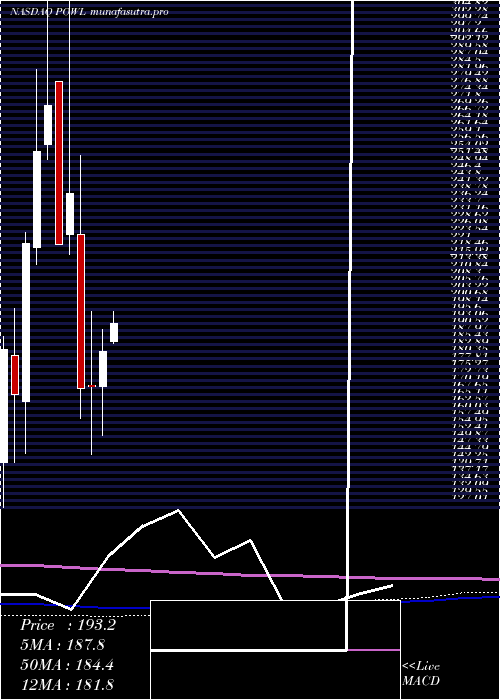
DMA SMA EMA moving averages of Powell Industries POWL
DMA (daily moving average) of Powell Industries POWL
| DMA period | DMA value | | 5 day DMA | 328.89 | | 12 day DMA | 313.65 | | 20 day DMA | 325.99 | | 35 day DMA | 344.28 | | 50 day DMA | 334.58 | | 100 day DMA | 297.93 | | 150 day DMA | 262.17 | | 200 day DMA | 240.01 | EMA (exponential moving average) of Powell Industries POWL
| EMA period | EMA current | EMA prev | EMA prev2 | | 5 day EMA | 331.1 | 325.59 | 320.01 | | 12 day EMA | 326.04 | 323.12 | 320.64 | | 20 day EMA | 328.35 | 326.9 | 325.86 | | 35 day EMA | 326.94 | 326.05 | 325.42 | | 50 day EMA | 330.77 | 330.31 | 330.05 |
SMA (simple moving average) of Powell Industries POWL
| SMA period | SMA current | SMA prev | SMA prev2 | | 5 day SMA | 328.89 | 325.11 | 322.11 | | 12 day SMA | 313.65 | 311.95 | 310.37 | | 20 day SMA | 325.99 | 327.63 | 330.59 | | 35 day SMA | 344.28 | 344.17 | 343.97 | | 50 day SMA | 334.58 | 333.41 | 332.55 | | 100 day SMA | 297.93 | 296.68 | 295.43 | | 150 day SMA | 262.17 | 261.16 | 260.14 | | 200 day SMA | 240.01 | 239.34 | 238.72 |
|
|
