PowerIntegrations POWI full analysis,charts,indicators,moving averages,SMA,DMA,EMA,ADX,MACD,RSIPower Integrations POWI WideScreen charts, DMA,SMA,EMA technical analysis, forecast prediction, by indicators ADX,MACD,RSI,CCI NASDAQ stock exchange
operates under Technology sector & deals in Semiconductors
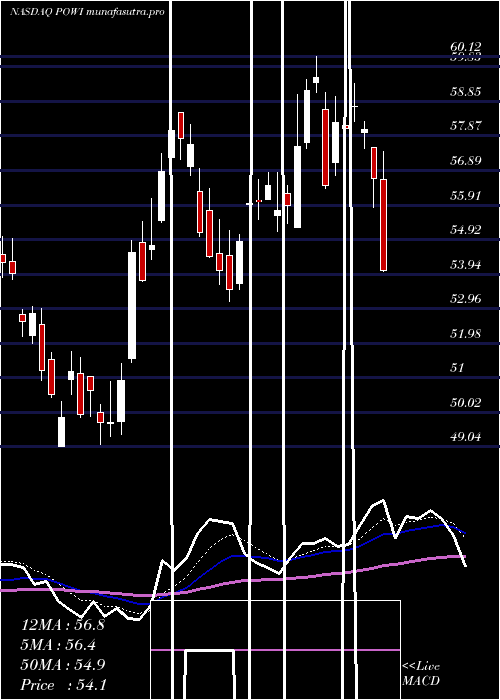
Daily price and charts and targets PowerIntegrations Strong Daily Stock price targets for PowerIntegrations POWI are 35.77 and 36.86 | Daily Target 1 | 35.52 | | Daily Target 2 | 36.01 | | Daily Target 3 | 36.606666666667 | | Daily Target 4 | 37.1 | | Daily Target 5 | 37.7 |
Daily price and volume Power Integrations
| Date |
Closing |
Open |
Range |
Volume |
Fri 05 December 2025 |
36.51 (-0.19%) |
36.88 |
36.11 - 37.20 |
1.304 times |
Thu 04 December 2025 |
36.58 (1.08%) |
36.13 |
35.56 - 36.76 |
0.8002 times |
Wed 03 December 2025 |
36.19 (4.72%) |
34.91 |
34.75 - 36.66 |
0.984 times |
Tue 02 December 2025 |
34.56 (2.58%) |
34.03 |
33.50 - 34.89 |
0.8453 times |
Mon 01 December 2025 |
33.69 (0.27%) |
33.09 |
32.81 - 34.41 |
1.068 times |
Fri 28 November 2025 |
33.60 (-0.39%) |
33.42 |
33.29 - 33.74 |
0.4187 times |
Wed 26 November 2025 |
33.73 (0.66%) |
33.39 |
33.24 - 33.93 |
1.1158 times |
Tue 25 November 2025 |
33.51 (0.87%) |
32.83 |
32.53 - 33.76 |
0.662 times |
Mon 24 November 2025 |
33.22 (0.48%) |
33.11 |
32.67 - 33.93 |
1.1897 times |
Fri 21 November 2025 |
33.06 (6.92%) |
30.97 |
30.97 - 33.20 |
1.6122 times |
Thu 20 November 2025 |
30.92 (-2.12%) |
32.25 |
30.86 - 32.28 |
1.0755 times |
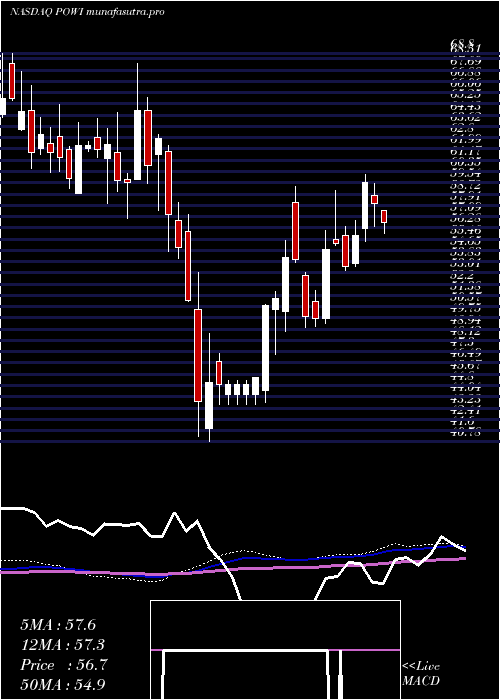
Weekly price and charts PowerIntegrations Strong weekly Stock price targets for PowerIntegrations POWI are 34.66 and 39.05 | Weekly Target 1 | 31.12 | | Weekly Target 2 | 33.81 | | Weekly Target 3 | 35.506666666667 | | Weekly Target 4 | 38.2 | | Weekly Target 5 | 39.9 |
Weekly price and volumes for Power Integrations
| Date |
Closing |
Open |
Range |
Volume |
Fri 05 December 2025 |
36.51 (8.66%) |
33.09 |
32.81 - 37.20 |
0.7163 times |
Fri 28 November 2025 |
33.60 (1.63%) |
33.11 |
32.53 - 33.93 |
0.485 times |
Fri 21 November 2025 |
33.06 (-4.45%) |
34.21 |
30.86 - 34.35 |
0.9302 times |
Fri 14 November 2025 |
34.60 (-1.96%) |
36.41 |
33.52 - 36.73 |
0.7004 times |
Fri 07 November 2025 |
35.29 (-15.76%) |
40.20 |
34.30 - 40.70 |
0.796 times |
Fri 31 October 2025 |
41.89 (0%) |
40.69 |
40.32 - 42.55 |
0.2435 times |
Fri 31 October 2025 |
41.89 (-2.6%) |
43.44 |
40.32 - 44.45 |
0.9011 times |
Fri 24 October 2025 |
43.01 (-5.2%) |
46.97 |
41.63 - 46.97 |
0.8203 times |
Fri 17 October 2025 |
45.37 (30.98%) |
35.70 |
35.65 - 50.41 |
3.7 times |
Fri 10 October 2025 |
34.64 (-10.28%) |
38.99 |
34.55 - 39.56 |
0.7072 times |
Fri 03 October 2025 |
38.61 (-3.52%) |
40.49 |
38.57 - 40.49 |
0.5622 times |
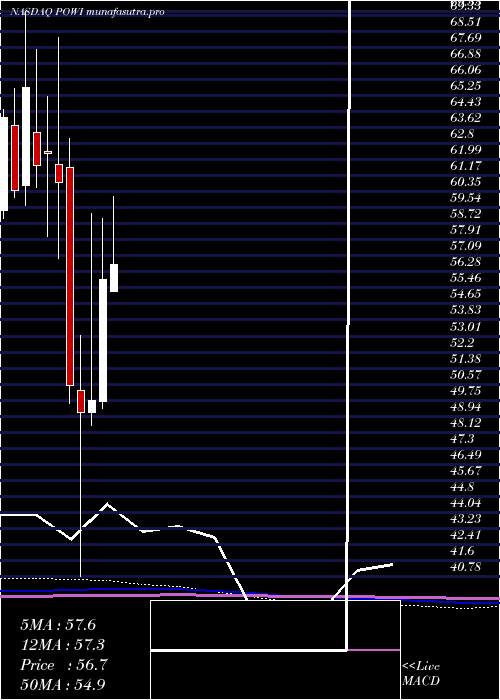
Monthly price and charts PowerIntegrations Strong monthly Stock price targets for PowerIntegrations POWI are 34.66 and 39.05 | Monthly Target 1 | 31.12 | | Monthly Target 2 | 33.81 | | Monthly Target 3 | 35.506666666667 | | Monthly Target 4 | 38.2 | | Monthly Target 5 | 39.9 |
Monthly price and volumes Power Integrations
| Date |
Closing |
Open |
Range |
Volume |
Fri 05 December 2025 |
36.51 (8.66%) |
33.09 |
32.81 - 37.20 |
0.2837 times |
Fri 28 November 2025 |
33.60 (-19.79%) |
40.20 |
30.86 - 40.70 |
1.1531 times |
Fri 31 October 2025 |
41.89 (4.18%) |
39.81 |
34.55 - 50.41 |
2.658 times |
Tue 30 September 2025 |
40.21 (-10.84%) |
44.07 |
39.15 - 46.24 |
0.9765 times |
Fri 29 August 2025 |
45.10 (-7.05%) |
47.66 |
39.53 - 50.30 |
0.9792 times |
Thu 31 July 2025 |
48.52 (-13.2%) |
55.26 |
47.74 - 60.12 |
0.6914 times |
Mon 30 June 2025 |
55.90 (12.41%) |
49.70 |
49.34 - 58.97 |
0.7027 times |
Fri 30 May 2025 |
49.73 (1.24%) |
49.12 |
48.48 - 59.24 |
0.8543 times |
Wed 30 April 2025 |
49.12 (-2.73%) |
50.22 |
40.78 - 53.02 |
0.9661 times |
Mon 31 March 2025 |
50.50 (-16.94%) |
61.59 |
49.57 - 63.04 |
0.7351 times |
Fri 28 February 2025 |
60.80 (-2.44%) |
61.74 |
56.97 - 68.20 |
0.7985 times |
DMA SMA EMA moving averages of Power Integrations POWI
DMA (daily moving average) of Power Integrations POWI
| DMA period | DMA value | | 5 day DMA | 35.51 | | 12 day DMA | 33.93 | | 20 day DMA | 34.13 | | 35 day DMA | 37.54 | | 50 day DMA | 38.49 | | 100 day DMA | 42.59 | | 150 day DMA | 46.53 | | 200 day DMA | 48.03 | EMA (exponential moving average) of Power Integrations POWI
| EMA period | EMA current | EMA prev | EMA prev2 | | 5 day EMA | 35.68 | 35.27 | 34.62 | | 12 day EMA | 34.95 | 34.67 | 34.32 | | 20 day EMA | 35.32 | 35.2 | 35.06 | | 35 day EMA | 36.53 | 36.53 | 36.53 | | 50 day EMA | 38.45 | 38.53 | 38.61 |
SMA (simple moving average) of Power Integrations POWI
| SMA period | SMA current | SMA prev | SMA prev2 | | 5 day SMA | 35.51 | 34.92 | 34.35 | | 12 day SMA | 33.93 | 33.54 | 33.18 | | 20 day SMA | 34.13 | 34.13 | 34.28 | | 35 day SMA | 37.54 | 37.84 | 38.19 | | 50 day SMA | 38.49 | 38.55 | 38.63 | | 100 day SMA | 42.59 | 42.77 | 42.94 | | 150 day SMA | 46.53 | 46.62 | 46.7 | | 200 day SMA | 48.03 | 48.18 | 48.32 |
|
|
